
Discovering the "Invisible Walls": A Data-Driven Approach to Social Segregation
Segregation discovery in a social network of companies
This paper introduces a data-driven framework for Segregation Discovery in social networks, utilizing quantitative segregation indexes (Dissimilarity, Entropy, and Isolation). The authors propose Algorithm 1, which treats the search for segregated subgroups and contexts as an itemset mining problem, and demonstrate its efficacy on a massive social network of Italian companies linked by shared directors.
TL;DR
Social segregation is no longer just about neighborhoods; it manifests in corporate boardrooms and digital networks. This paper presents a framework to automatically discover segregated groups (like gender or age minorities) within complex networks. By treating segregation as a "pattern mining" problem, the authors successfully mapped hidden imbalances across the entire Italian corporate ecosystem.
The Core Motivation: Moving Beyond Hypotheses
In the past, social scientists studied segregation by asking specific questions: "Are women underrepresented in New York law firms?" This is hypothesis testing. However, this approach risks missing what we don't think to ask.
The authors argue for Segregation Discovery: a data-driven process that scans millions of combinations of "Segregation Attributes" (who is being excluded) and "Context Attributes" (where is it happening) to highlight where the numbers don't add up.
Methodology: The Mining of Inequality
The authors bridge the gap between Social Science and Data Mining. They utilize three classic indexes:
- Dissimilarity (D): Measures how unevenly a minority is spread across units.
- Information Index (H): Measures the reduction in "uncertainty" of group membership within units.
- Isolation (I): Measures the likelihood of a minority member interacting only with their own group.
Breaking the "Giant Component"
In the Italian company network, a "giant component" connects 20% of all directors. This massive cluster hides smaller, segregated pockets. The authors' brilliant insight was to use structural decomposition: they removed "weak ties" (where companies shared only a few directors) until the network broke into meaningful, discrete units for analysis.
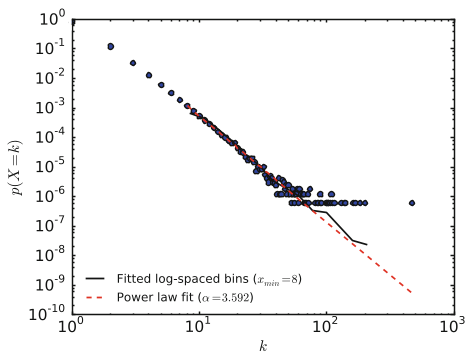 Figure: The distribution of Connected Components (CCs) before and after splitting the giant component.
Scalable Discovery: Algorithm 1
The proposed algorithm iterates through combinations of context and segregation attributes, using bitmap-based support counting for speed.
- Input: Relational table (age, gender, sector, region).
- Mechanism: It calculates the chosen index for every subgroup.
- Complexity: Optimized for large-scale datasets, but essentially probes the exponential search space of attribute combinations.
Experimental Results: The State of Italian Boards
The study analyzed a 2012 snapshot of the Italian Business Register. The scale is immense: 2.2M companies and nearly 6M edges.
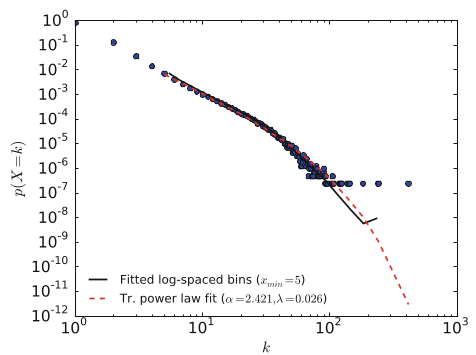 Figure: Distribution of Board sizes and Director presence, showing a heavy-tailed power-law distribution.
Shocking Findings
- Agriculture: Found to be the most segregated sector for young women (Age 38, Female). With a dissimilarity index of 0.916, it represents a near-total separation from the majority.
- Electricity & Gas: This sector showed intense Isolation for males (). In these boards, men almost exclusively interact with other men, creating a self-reinforcing "old boys' club" environment.
Critical Insight & Conclusion
While the paper focuses on corporate Italian boards, the framework is sector-agnostic. It could easily be applied to:
- Online Social Networks: Identifying "filter bubbles" where political groups never interact.
- Education: Tracking segregation in school choice programs.
The main limitation is that the framework identifies that segregation exists, but doesn't explain why (causality). Are these choices, or is there systemic discrimination? Regardless, this work provides the "map" that policy makers need to start asking the right questions.
Takeaway: By reframing social problems as pattern mining tasks, we can uncover societal imbalances that were previously invisible to the naked eye.