
Bridging the Climate Awareness Gap: Semantic Tools for Environmental Communication
Semantic Systems and Visual Tools to Support Environmental Communication
The paper presents a visual analytics platform (webLyzard) designed for environmental communication. It integrates semantic technologies to extract factual and affective knowledge from heterogeneous online sources, visualizing lexical, geospatial, and relational contexts for stakeholders like NOAA and WWF.
TL;DR
Despite the prevalence of climate data, public action remains stagnant due to information overload and a lack of perceived personal impact. This paper presents a sophisticated visual analytics platform that uses semantic knowledge extraction to map the "Who, Where, and How" of environmental discourse. By visualizing lexical, geospatial, and relational contexts, it allows organizations like NOAA to measure communication success through a proprietary metric called WYSDOM, moving beyond simple "positive vs. negative" sentiment.
Problem & Motivation: The Signal-to-Noise Ratio in Climate Change
Public concern about the environment has peaked, yet personal carbon footprints remain high. The authors identify two psychological hurdles: a lack of collective awareness (perceiving the risk as distant) and a lack of personal efficacy (feeling that individual actions are futile).
The problem is exacerbated by the digital landscape. Citizens are bombarded with conflicting information from news and social media. Existing analytics often provide simple bar charts that ignore the context of the conversation. Without understanding the relationship between actors, locations, and the specific language used (Lexical Context), organizations cannot tailor their message to bridge the gap between scientific facts and public perception.
Methodology: Mining Factual and Affective Knowledge
The authors propose a processing pipeline that transforms unstructured web content into "Actionable Knowledge" using three semantic pillars:
- Factual Knowledge (Recognyze): Uses Linked Data (DBpedia, Freebase) for Named Entity Recognition (NER). Unlike ML-based systems that require massive training sets, this approach relies on external knowledge bases to disambiguate entities like personas, organizations, and locations.
- Affective Knowledge: Goes beyond basic sentiment. The system uses a context-aware sentiment lexicon that accounts for shifts in meaning when specific environmental terms co-occur (e.g., "Climate Change" is typically negative in sentiment but is a "desired" topic for scientific outreach).
- Visual Analytics Dashboard: A synchronized interface that allows users to explore data through different lenses simultaneously.
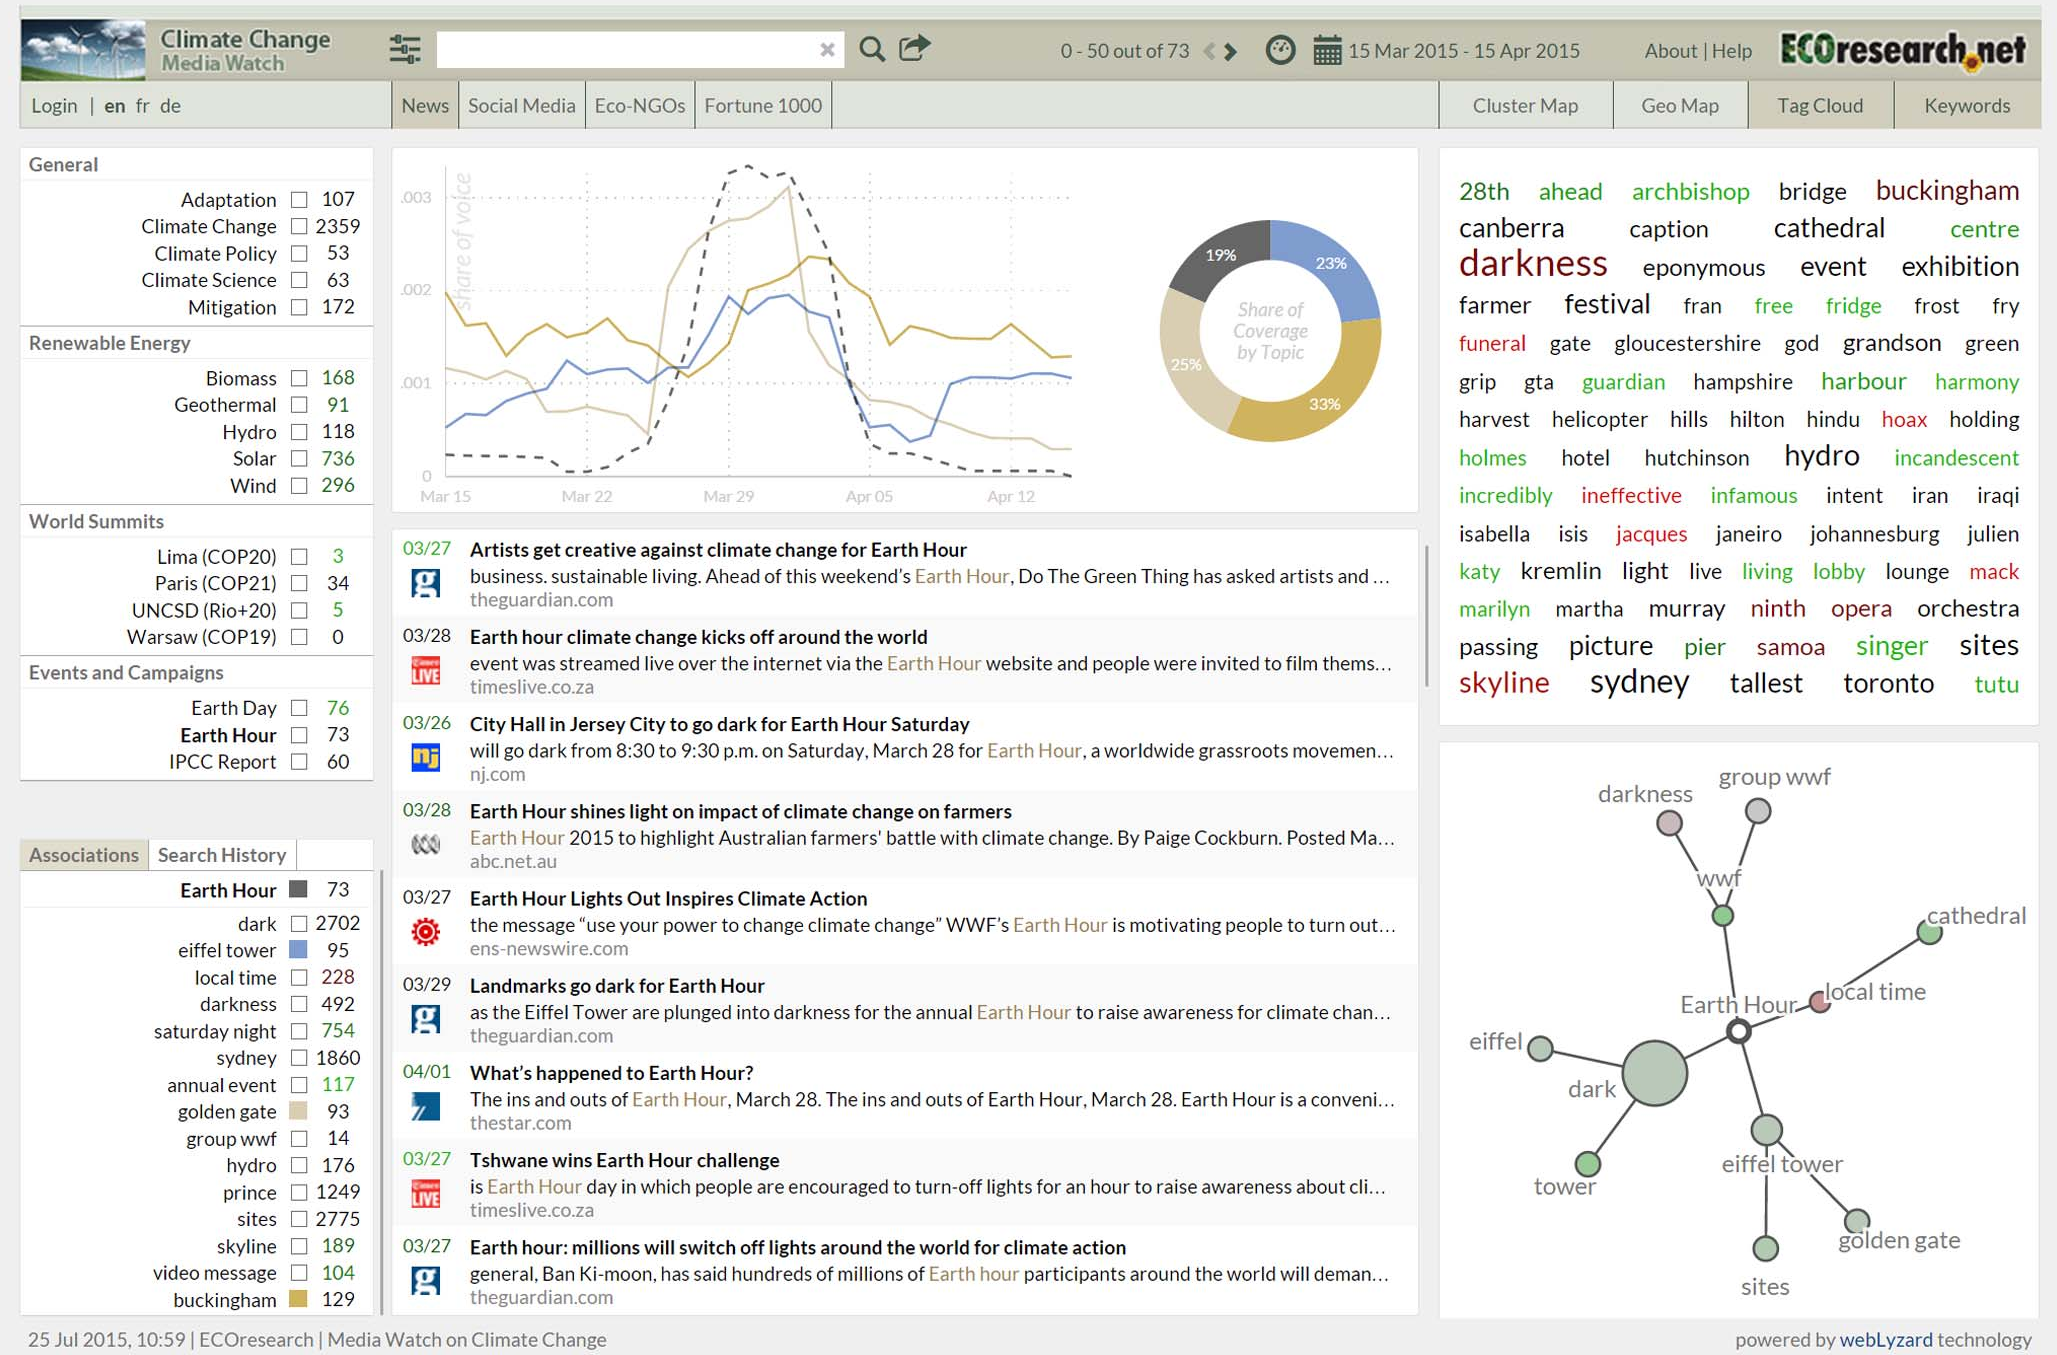 Figure 1: The Media Watch on Climate Change dashboard interface.
Contextual Visualization: The Three Pillars
The platform provides three unique ways to view information flow:
- Lexical Context (Word Tree): A symmetrical visualization that shows the root search term (e.g., "Earth Hour") with prefixes and suffixes, helping analysts see exactly how phrases are constructed in public discourse.
- Geospatial Context: Maps references found within documents. This distinguishes between where the author is and the place they are talking about, which is crucial for identifying regional environmental threats.
- Relational Context (Entity Map): Uses a radial convergence diagram to show links between entities (e.g., the relationship between the WWF and specific political leaders).
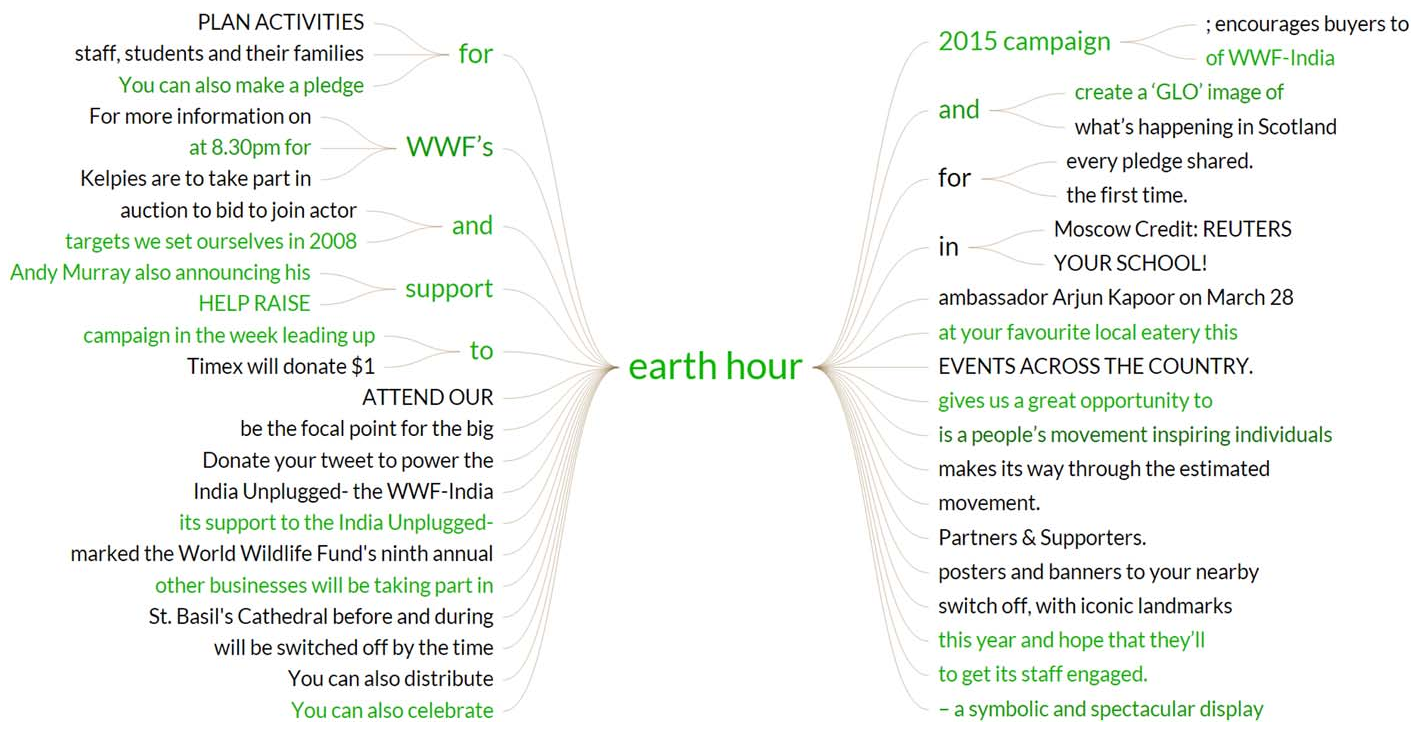 Figure 2: The Entity Map showing co-occurrence patterns and sentiment between organizations and individuals.
Experiments & Results: Beyond Sentiment with WYSDOM
The most significant contribution for practitioners is and WYSDOM (webLyzard Stakeholder Dialogue and Opinion Model). Traditional sentiment analysis is a "bipolar" assessment (Positive vs. Negative). WYSDOM is a hybrid success metric that incorporates:
- Association with desired vs. undesired topics.
- Web traffic (visits and page views).
- Sentiment trends over time.
Quantifiable Performance: The context-aware sentiment analysis improved the F-measure significantly, rising from 64.2% to 73.7%. In specific datasets like TripAdvisor hotel reviews, it reached as high as 81%.
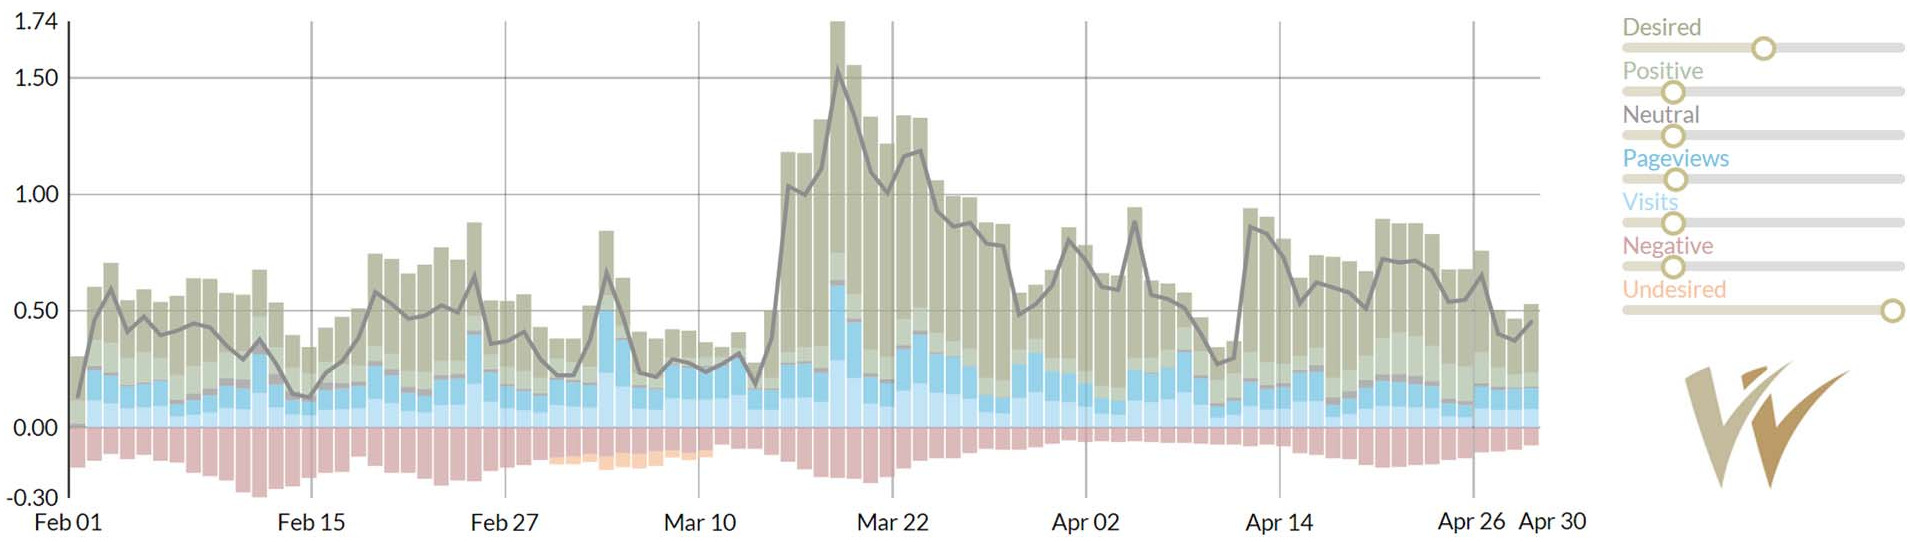 Figure 3: The WYSDOM bar chart measuring communication goals.
Critical Analysis & Conclusion
The platform's strength lies in its ability to handle heterogeneous data—from social media to news—and transform it into a cohesive semantic space.
Limitations:
- Complexity: Usability testing revealed that first-time users found the full dashboard overwhelming. The authors addressed this by creating a simplified mobile version, but the inherent complexity of multi-dimensional data remains a challenge.
- Precision/Recall Trade-off: While the "Recognyze" component is highly flexible because it doesn't require training data, its F-measure for entity linking (0.63) is slightly lower than some specialized deep-learning models.
Future Outlook: The project is evolving to handle veracity detection (identifying myths and rumors) and scalability. As we move into an era of AI-generated misinformation, the ability to semantically map the origin and sentiment of information flows will be indispensable for science communication professionals.