
Sensible Organizations: Beyond E-mail and Surveys to the "Social Physics" of Work
7928_Sensible Organizations Technology and Methodology for Automatically Measuring Organizational Behavior.
This paper introduces the "Sociometric Badge," a wearable computing platform designed to automatically measure organizational behavior through face-to-face interaction, physical proximity, and vocal social signals. By deploying these sensors in a real-world banking environment, the authors established a methodology to quantify social dynamics and predict employee job satisfaction with significant accuracy.
TL;DR
Researchers from the MIT Media Lab have developed a Sociometric Badge—a wearable device that acts as a "microscope" for human behavior. By tracking physical proximity, face-to-face talk time, and body movement, they can predict job satisfaction and team quality far more accurately than by reading e-mails or conducting surveys.
The Problem: The Bias of Memory and the Invisibility of Action
For decades, managers and social scientists have relied on surveys to ask employees: "How satisfied are you?" or "How well did your team collaborate?" The problem? Humans are notoriously bad at remembering their interactions objectively.
Furthermore, while "Digital Exhaust" (e-mail, Slack, Teams logs) is easy to track, it misses the most crucial part of being human: Face-to-face interaction. This paper argues that by ignoring the physical reality of the office, we are only seeing a fraction of the organizational picture.
Methodology: High-Tech Badges for "Honest Signals"
The authors manufactured 300 sociometric badges equipped with a suite of sensors:
- Infrared (IR): Acts as a proxy for "eye contact" and direct face-to-face interaction (only triggers when two people face each other).
- Bluetooth: Detects proximity within 10 meters, identifying who is "reachable" even if not currently talking.
- Accelerometers: Measures "Social Motion" (activity levels, mirroring, and energy).
- Microphones: Not for recording words (privacy first!), but for measuring speaking time, pace, and influence.
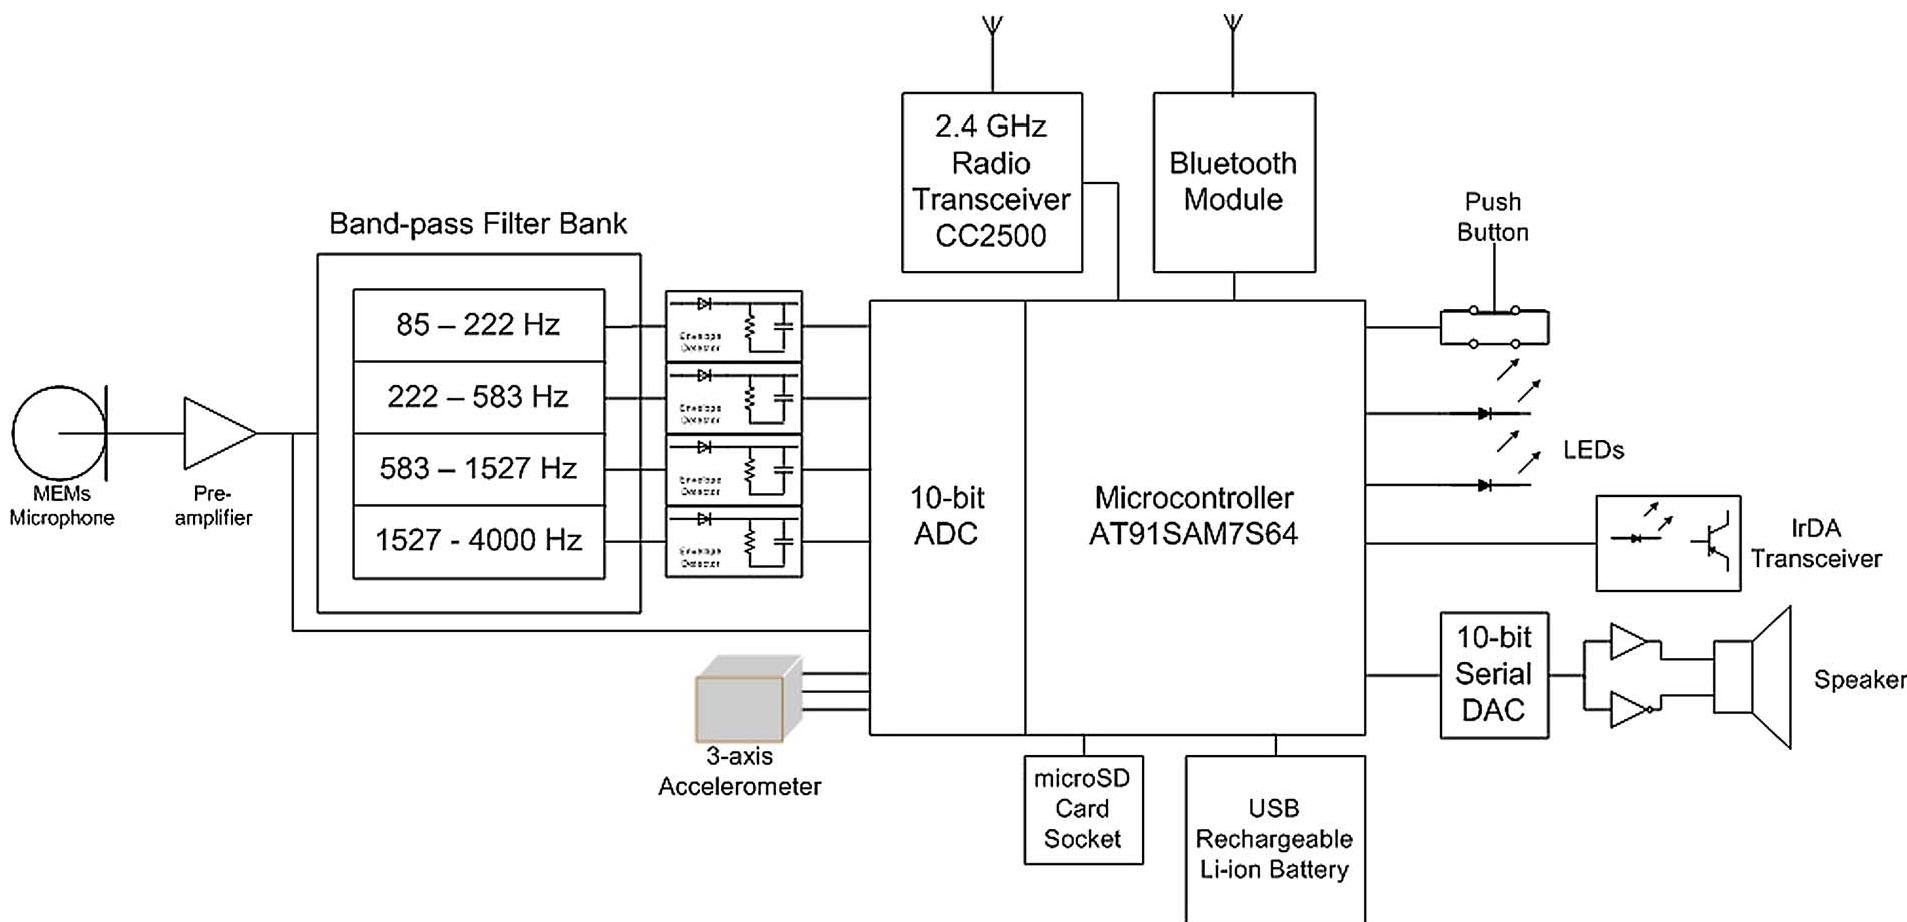 Figure 1: The Sociometric Badge System Block Diagram.
The "Total Communication" Insight
One of the paper’s most provocative findings was the "Negative Correlation" between physical proximity and e-mail.
- The Discovery: People who are physically close send fewer e-mails (r = -0.55).
- The Implication: If a researcher only looks at e-mail data to map a company's social network, they will incorrectly assume the people who sit next to each other have no relationship. In reality, they are interacting the most—just not digitally.
Experiments and Results: Predicting Satisfaction
The team deployed these badges at a German bank for 20 days. They found that Betweenness Centrality (a measure of how much a person acts as a "bridge" or "gatekeeper" between different groups) was a strong predictor of dissatisfaction.
If you are the "bridge" in a communication-heavy environment, you are likely experiencing Communication Overload. The data showed that the higher your total communication volume (e-mail + face-to-face), the lower your job satisfaction.
 Figure 2: Impact of physical layout (floors) on e-mail volume and proximity.
Future Applications: The "Meeting Mediator"
The paper doesn't just stop at measurement; it suggests interventions:
- Sensible Orb: A desk lamp that changes color based on your cognitive load (Red = Stressed, White = Flow State).
- Meeting Mediator: A real-time app that shows a group if one person is dominating the conversation, encouraging "speaking balance."
 Figure 3: Real-time feedback visualizing turn-taking and balance in a team meeting.
Conclusion & Critical Analysis
This work serves as the foundation for Computational Social Science. It proves that organizational dynamics are not just "vibes"—they are quantifiable physical events.
Limitations: The study was conducted in 2008; today’s remote-work reality complicates the "IR/Physical Proximity" model. However, the core takeaway remains: unconscious social signals are the true pulse of an organization. To understand a team, stop reading their e-mails and start measuring their rhythm.