
Decoding the Espresso Experience: A CUB Model Approach to Sensory Marketing
Sensory analysis in the food industry as a tool for marketing decisions
This paper introduces a hybrid framework combining CUB (Combination of Uniform and shifted Binomial) models with Random Forest (RF) variable importance measurements for food industry sensory analysis. Applied to an Italian espresso case study with 36 coffee varieties, the method identifies critical sensory drivers and socio-demographic covariates that inform marketing decisions.
Executive Summary
TL;DR: This research transforms qualitative coffee ratings into actionable marketing intelligence by leveraging CUB models—a statistical framework that separates a consumer's true "feeling" from "uncertainty." By applying this to Italian espresso, the authors identify how age, sugar habits, and even the psychological "vibe" of a product (e.g., being "luxurious") drive overall satisfaction and sensory perception.
Positioning: This work is a significant methodological contribution to Sensometrics. It bridges the gap between rigorous statistical modeling of ordinal data and modern algorithmic data mining (Random Forest), providing a blueprint for data-driven product development and advertising.
The Problem: The "Noise" in Human Choice
When a consumer rates a coffee 7 out of 9, what does that number actually mean? In traditional marketing:
- Ordinal Distortion: We often treat "7" as a number, but it is actually an ordinal category. The "distance" between 1 and 2 isn't necessarily the same as between 8 and 9.
- The Uncertainty Factor: Some consumers are decisive; others are "fuzzy" or indifferent. Standard averages conflate these two groups, leading to "noisy" data.
The authors argue that sensory satisfaction is a combination of two latent (hidden) processes: a deliberate feeling towards the item and an intrinsic uncertainty caused by lack of knowledge or the nature of the scale.
Methodology: The CUB Framework
The core of the paper is the CUB model (Combination of Uniform and shifted Binomial).
1. The Stochastic Decomposition
The model defines the probability of a rating as:
- (Feeling): Represents the probability of a positive evaluation. As increases, sensory satisfaction increases.
- (Certainty): Determines how much the Binomial component dominates. measures the "uncertainty" or randomness in the response.
2. Model Architecture
By mapping these parameters on a unit square, researchers can visualize the positioning of products. Products in the top-right have high satisfaction and low uncertainty; those towards the bottom-left are controversial or poorly understood.
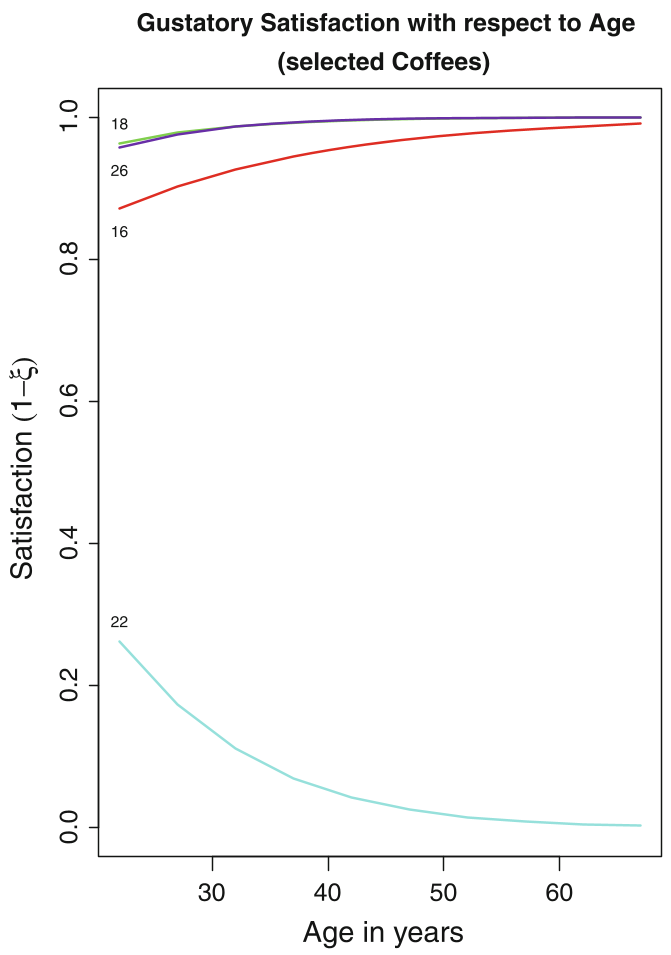 Figure: The unit square shows the relative positioning of different coffee varieties according to feeling and uncertainty. (Image Placeholder: CUB Parametric Space)
Key Insights from the Espresso Case Study
The researchers analyzed 36 coffee varieties with over 7,000 judgments. Here are the most striking findings:
Sight and Smell Over Taste
The study found that gustatory satisfaction (taste) is heavily modulated by olfactory ratings (smell). Interestingly, visual and olfactory perceptions showed high similarity in their evaluation patterns, whereas taste was much more subjective (higher uncertainty).
Covariate Impact: Not All Consumers are Equal
Using extended CUB models with covariates, the researchers discovered:
- The Age Factor: Satisfaction for some coffees increased with age but crashed for others (e.g., Variety 22), suggesting clear targets for age-based market segmentation.
- The Sugar Paradox: For varieties 4 and 11, sugar increased satisfaction. However, for varieties 13 and 26, sugar actually decreased the perceived quality.
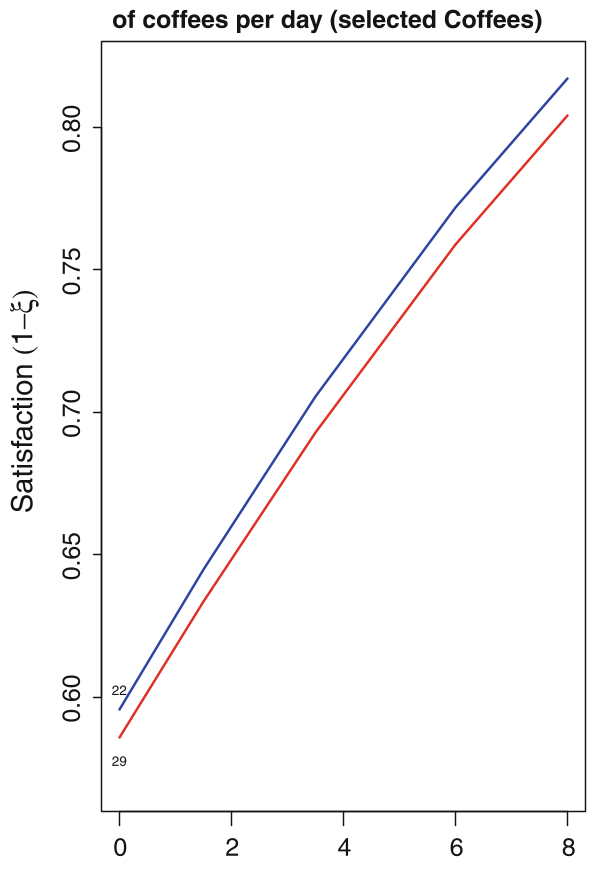 Figure: How Age, Sweetness, and Consumption Frequency influence the feeling parameter across various coffees.
The "Luxurious" Driver (Random Forest Integration)
To find out what "kind of person" a coffee is for, the authors used Random Forest. They found that the perceived frequency of a coffee being "sophisticated/luxurious" was the strongest predictor of overall satisfaction.
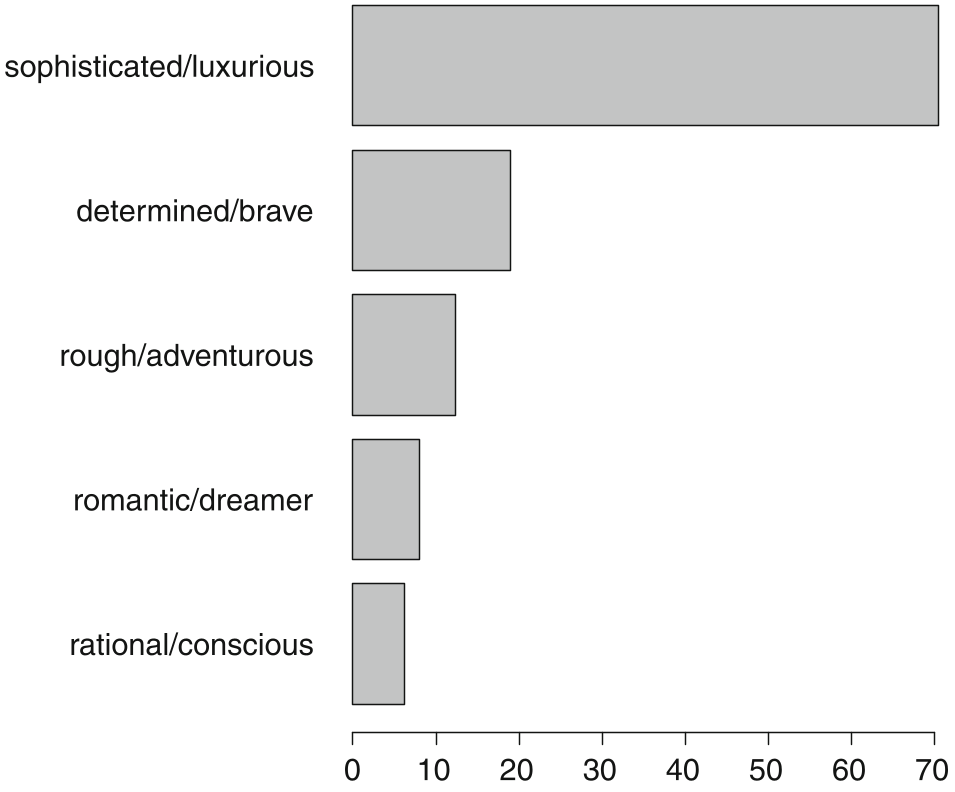 Figure: Variable Importance Measure (MDA) showing "Sophisticated/Luxurious" as the dominant driver of sensory satisfaction.
Critical Analysis & Conclusion
Takeaway
This methodology proves that sensory analysis isn't just about "taste tests"—it is about understanding the psychological architecture of preference. By separating feeling from uncertainty, brands can identify if a low rating is due to a bad product (low feeling) or a confusing brand message (high uncertainty).
Limitations
- Model Complexity: Implementing CUB models requires professional statistical software (like R) and high-level training compared to simple mean-variance analysis.
- Self-Selection Bias: The visitors in the case study were attendees of a "Coffee Experience" event, who likely have higher-than-average interest/expertise in coffee.
Future Outlook
The integration of CUB models with automated data mining like Random Forest opens the door for real-time sensory feedback loops in the food industry. Future research could explore "shelter effects" (when people choose the neutral middle option to avoid commitment) and how this impacts automated recommendation systems for food products.