
Sentiment Beyond the Count: Decoding Public Reaction to Medical Research on Twitter
Sentiment Analysis of Tweets Mentioning Research Articles in Medicine and Psychiatry Disciplines
This study investigates the sentiment distribution of tweets mentioning scholarly publications in the Medicine and Psychiatry domains using a supervised machine learning approach. The authors developed an optimized Support Vector Machine (SVM) classifier that achieved a peak accuracy of 91.6%, facilitating a large-scale analysis of altmetrics beyond simple mention counts.
TL;DR
Researchers from Nanyang Technological University have moved beyond simple "mention counts" to analyze the emotional valence of tweets discussing medical and psychiatric research. By training a high-precision SVM classifier (91.6% accuracy), they discovered that while most tweets remain neutral, there is a burgeoning trend of public opinion—both positive and negative—shaping the modern impact of scholarly work.
Background: Why "Metrics" Aren't Enough
In the traditional academic world, a citation is the gold standard of impact. However, in the digital age, a paper might be tweeted thousands of times without ever being cited in a formal journal. This is the realm of Altmetrics.
The problem? A tweet saying "This study is a breakthrough!" carries the same weight in raw altmetric scores as one saying "This study is fundamentally flawed." Most prior attempts to solve this used "off-the-shelf" sentiment tools that weren't tuned for the specific, often complex language used when sharing medical research.
Methodology: Engineering a Better Classifier
The authors didn't just plug data into a black box. They curated a dataset from top-tier Medicine and Psychiatry journals (indexed in SCI/SSCI) and applied a rigorous pipeline:
- Title Sanitization: They removed article titles from the tweets. This is crucial because a paper titled "Chronic Pain and Depression" contains "negative" words that don't reflect the user's sentiment, just the subject matter.
- Feature Fusion: The model combined traditional Bag-of-Words (TF-IDF) with:
- Subjectivity Lexicons (MPQA): To detect "opinionated" words.
- Rule-based tools (Vader): To capture the intensity of the sentiment.
- Structural Metadata: Counting hashtags, uppercase characters, and negations.
- Class Balancing: Since neutral tweets are the vast majority (creating a "long tail" problem), they used balanced class weights to ensure the model didn't ignore the rarer positive and negative signals.
 Note: The study utilized a comprehensive feature set to reach 91.6% accuracy.
Key Insights: Medicine vs. Psychiatry
The study applied the best-performing model (SVM) to over 160,000 tweets. The results provide a fascinating look at how the public interacts with science:
- The Rise of Subjectivity: In the Medicine domain, the percentage of neutral tweets dropped from 89.05% in 2015 to 79.75% in 2017. People are becoming more comfortable expressing specific praise or criticism online.
- Psychiatry's Unique Profile: Unlike general medicine, the Psychiatry domain showed a higher percentage of negative tweets (6.7%) than positive ones (6.0%). The authors suggest that users are "keener on discussing negative opinions related to mental health problems," reflecting the sensitive and debated nature of the field.
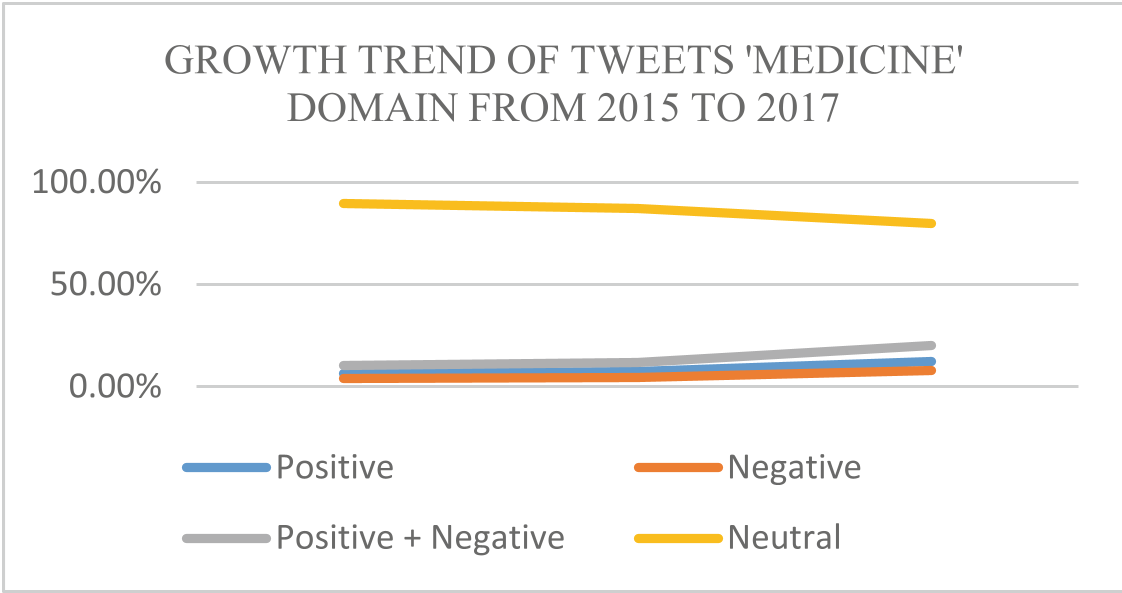 Fig 1: The increasing trend of subjective (positive/negative) engagement in the medicine domain.
Critical Analysis & Future Outlook
This work represents a vital step toward Qualitative Altmetrics. By proving that machine learning can accurately filter out the "noise" of neutral citations, it opens the door for journals to provide "Sentiment Dashboards" for authors.
Limitations: Despite the high accuracy, the study relies on a "bag-of-features" approach. Modern LLMs (like RoBERTa or GPT-4) could potentially capture sarcasm or deeper context better than SVMs. Furthermore, the dataset was limited to English tweets, leaving a huge portion of global scientific discourse unanalyzed.
The Takeaway: If you are an academic or a publisher, remember: the public is no longer just "counting" your work—they are talking about it, and those conversations are becoming increasingly polarized.
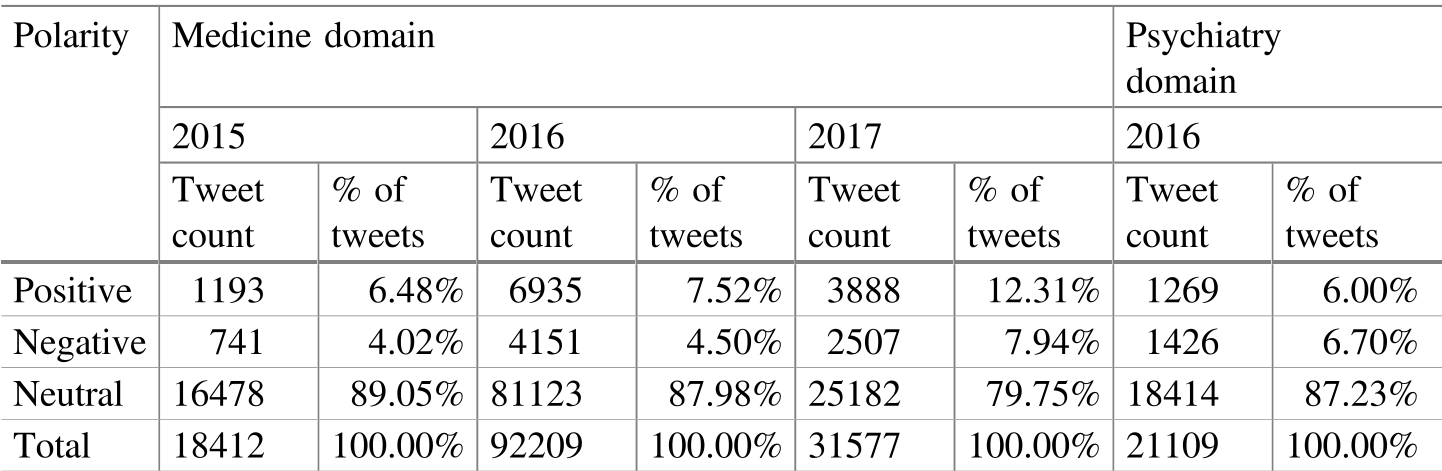 Table 1: Quantitative breakdown of sentiment distribution across years and domains.