
Unveiling the "Social Life" of Products: Network Theory in Shopping Basket Analysis
Shopping basket analysis based on the social network theory
This paper applies Social Network Analysis (SNA) to the FOODMART retail dataset to model product relationships as a "Product-Product" network. By analyzing topological features, it identifies that commercial product networks exhibit small-world properties but follow a Poisson degree distribution rather than a power-law distribution.
TL;DR
This research transforms thousands of supermarket transactions into a complex "Social Network" of products. Unlike human social networks that often follow a "rich-get-richer" power-law pattern, the authors discover that product networks are essentially random networks with small-world characteristics. This insight allows managers to identify hidden "product cliques" that reveal the demographic structure of their customers—such as identifying young parents through the proximity of "Children’s Aspirin" and "Apple Candies."
The Shift from Micro-Rules to Macro-Networks
For decades, retailers relied on Association Rules (the classic "Beer and Diapers" anecdote). While useful, these rules are micro-level pointers. They don't tell you the "shape" of your store's demand.
The authors argue that by treating products as nodes in a social network, we can use the mathematics of graph theory to understand:
- Connectivity: How quickly does one purchase lead to another?
- Robustness: If a core product is out of stock, does the whole "basket logic" collapse?
- Clustering: Do products naturally form "tribes" or communities?
Methodology: Building the Product Graph
The study uses the Foodmart 2008 dataset, focusing on a large US store with 1,559 products and over 3,300 baskets.
The Construction Process
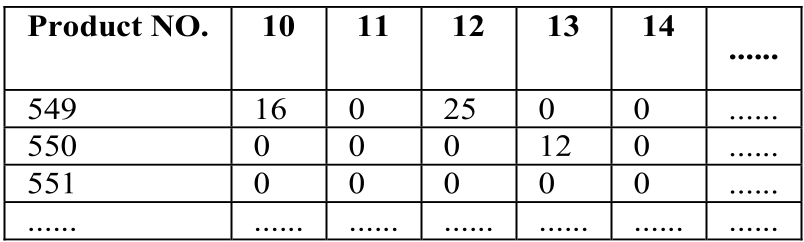
- Adjacency Matrix: If Product A and Product B appear in the same basket, an edge is drawn. The "weight" of the edge is determined by the frequency of co-purchase.
- Visualization: Using tools like Pajek and UCINET, the researchers visualized the topology.
 Note: Even at the catalog level, the network reveals dense local clusters vs. sparse global connections.
Key Findings: Why Your Store is a "Small World"
The paper uncovers several surprising topological features:
1. It’s Not a Scale-Free Network
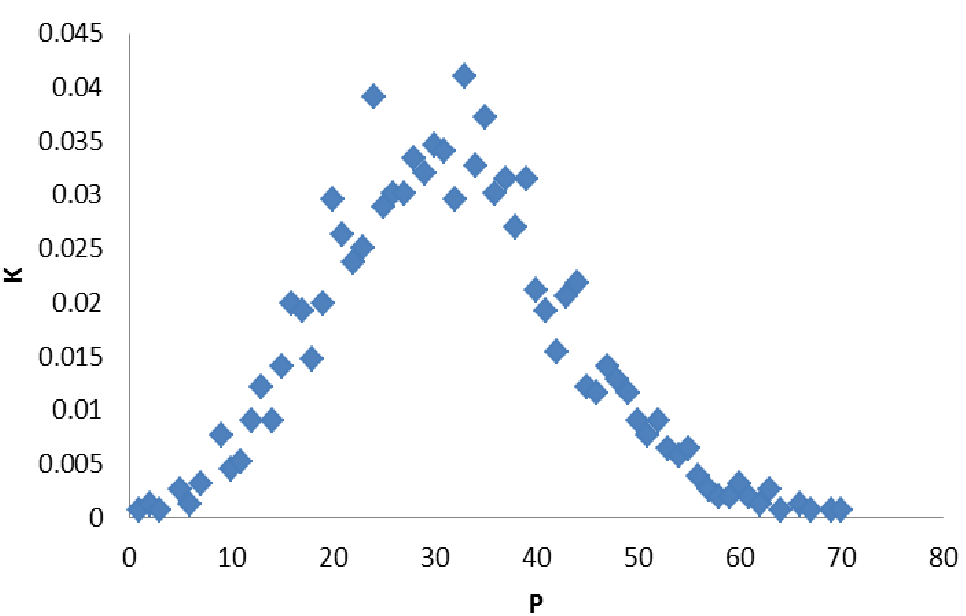
In most social networks (like Twitter), a few "celebrity" nodes have millions of links while most have few. This is a Power-Law distribution. However, the Product Network follows a Poisson distribution.
- Insight: Most products have a consistent, average number of "neighbors" (around 31-33). Consumers rarely buy just one item, but they also don't buy the whole store, creating a surprisingly balanced network.
2. The 2.57 Degree of Separation
The average path length is only 2.57. This means any product in the supermarket is roughly 2.5 steps away from any other product in the minds of consumers. This "Small World" effect suggests high strong connectivity, meaning localized promotions can have a ripple effect across the entire store.
Advanced Insight: Discovering Product "Cliques"
Using a Pruning Algorithm, the authors isolated "cliques"—subgraphs where every single product is connected to every other product in that group.
- Young Parent Clique: Found items like Canned Tuna, Apple Candies, Ice Cream, and Children’s Aspirin.
- Middle-Aged Household Clique: Found items like Turkey Hot Dogs, Sesame Oil, and Nasal Spray.
Why this matters? It allows for "Attribute-Based Layout." Instead of putting all canned goods in one aisle, managers can co-locate items belonging to the same demographic clique to increase cross-selling.
Critical Analysis & Conclusion
Takeaway for Retailers
The most significant contribution of this work is the validation of the Random Network model for retail. It proves that shopping behavior is more "stochastic" than "centralized." Success in retail layout isn't about catering to a few "star products" (Scale-free logic) but about managing the dense, local "cliques" (Random logic).
Limitations
- Static View: The study treats the network as a snapshot. In reality, product networks are dynamic (seasonal changes, holiday shifts).
- Unweighted Bias: While the study acknowledges frequency, the primary analysis treats the network as unweighted, potentially losing the nuance of "must-buy" vs. "impulse-buy" connections.
Future Outlook
The next frontier is Dynamic Evolution Analysis—watching how these cliques form and dissolve over a year. By combining Social Network Theory with Deep Learning, retailers could predict the "birth" of a new consumer trend before it hits the mainstream.