
Beyond the Map Surface: Leveraging Height Data for Precision Population Estimation
A Comparison of Small-Area Population Estimation Techniques Using Built-Area and Height Data, Riyadh, Saudi Arabia
This paper evaluates small-area population downscaling techniques in Riyadh, Saudi Arabia, by integrating Landsat ETM+ land cover data with IKONOS-derived digital height models. It compares eight different models across two main frameworks: Statistical Regression (Regression Through the Origin) and Areal Interpolation (Dasymetric Mapping), identifying volumetric dasymetric mapping and height-masked regression as superior methods for urban population estimation.
Executive Summary
TL;DR
This study tackles the challenge of "Downscaling" population data—taking coarse ward-level census info and projecting it onto individual parcels. By integrating Landsat ETM+ imagery with remotely sensed height data, researchers developed a suite of models that prove that "height" is the missing ingredient in urban density modeling. The results show that traditional 2D mapping (built area only) is highly inaccurate, while Volumetric Dasymetric Mapping and Height-Masked Regression can cut estimation errors by more than half.
Academic Positioning
This work sits at the intersection of Remote Sensing and Quantitative Geography. It transitions population estimation from 2D "flat-earth" models to 3D volumetric analysis, specifically addressing the unique urban morphology of the Middle East (Riyadh).
The "Flat Earth" Problem in Census Data
Most population studies rely on 2D land-cover maps: if a pixel looks like a building, someone must live there. However, this leads to two major technical failures:
- Spectral Confusion: In arid regions like Riyadh, bare soil and asphalt often look spectrally identical to concrete rooftops, leading to "ghost" populations in empty lots.
- Vertical Blindness: A single-story villa and a five-story apartment complex might have the same 2D footprint but vastly different population counts.
The authors' core Insight is that height data is not just an extra variable—it is a filter for accuracy and a multiplier for density.
Methodology: The 3D Advantage
The researchers tested two pipelines: Statistical Modeling (Regression) and Areal Interpolation (Dasymetric Mapping).
1. Statistical Modeling with RTO
They utilized Regression Through the Origin (RTO), founded on the logical premise that if "Built Area = 0", then "Population = 0".
- Innovative Use of Height: Instead of just using height as a raw number, they created VAHS (Volume-Adjusted Habitable Space)—calculated by multiplying built area proportion by the estimated number of floors.
- The Masking Technique: They used height to "mask" the Landsat data. If a pixel was classified as "built" but had a height of 0 meters, it was reclassified as bare land, drastically increasing the "User’s Accuracy" of the land cover map.
 Fig 1: The workflow for dasymetric mapping, integrating source census zones with target parcel zones using ancillary height data.
2. Volumetric Dasymetric Mapping
This approach uses the "Zone Preservation" principle. Unlike regression, which might estimate a total population higher than the actual census, dasymetric mapping ensures the total sum remains constant while using height to decide exactly where within a ward people are likely to be clustered.
Experimental Results & Critical Comparison
The study compared 8 models. The jump in accuracy when moving from 2D logic (Model 1) to 3D-integrated logic (Model 6) was stark.
| Metric | Model 1 (2D Only) | Model 6 (Height-Masked Class) | Model 7 (Dasymetric) |
|---|---|---|---|
| RMSE | 9.1 | 4.3 | 1.4 |
| MAE | 4.0 | 2.2 | 0.76 |
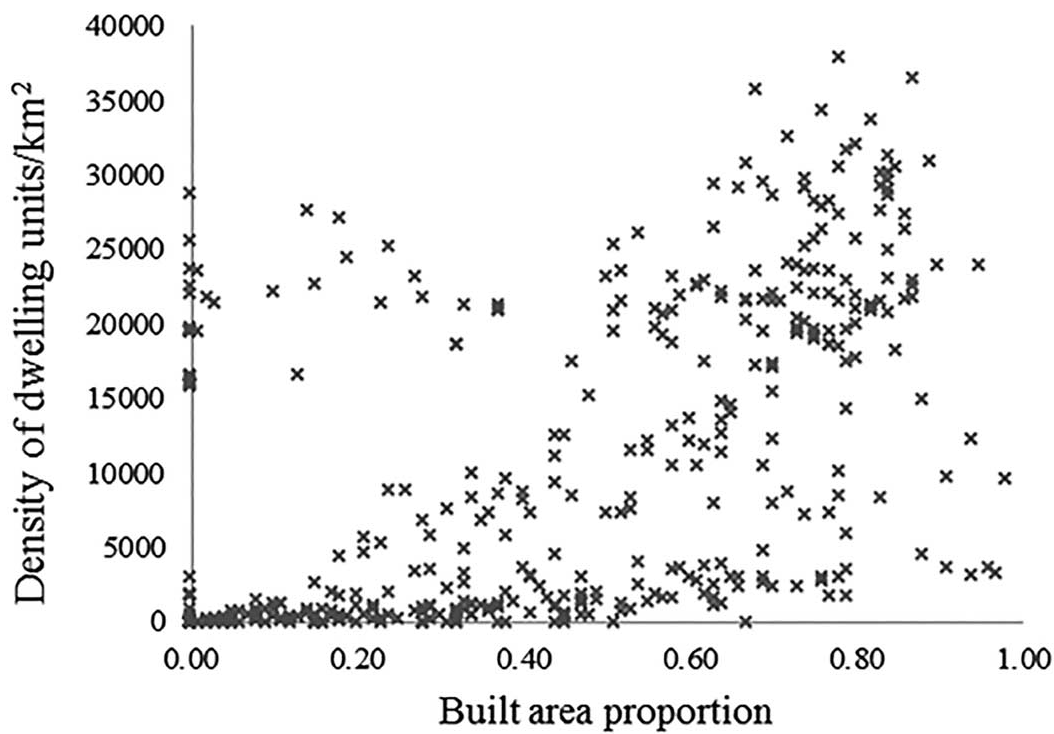 Fig 2: The non-linear relationship between building footprint and actual dwelling density, justifying the need for floor-count adjustments.
Key Insights from the Data:
- Height as a Filter: Model 5 (Built Area Masked with Height) reduced RMSE from 9.1 to 4.4. This proves that height's most valuable role was actually correcting 2D misclassifications of bare land.
- Scalability: While Dasymetric Mapping (Model 7) was the most accurate, it requires existing census data. In areas with no census data, Model 6 (Statistical) provides a viable "census-from-heaven" alternative.
Deep Insight: Why Volumetric Models Win
Standard regression assumes a "Global Consistency"—that the relationship between building size and people is the same everywhere. This is rarely true. Dasymetric mapping succeeds because it treats each source zone as its own local ecosystem, using height only to distribute the known "mass" of population.
Critical Analysis & Conclusion
Takeaway
The integration of vertical dimensionality (height) is no longer "optional" for urban remote sensing. It effectively solves the problem of spectral ambiguity in arid environments and accounts for the vertical densification of modern cities.
Limitations
The study noted that even with height data, non-residential buildings (mosques, schools) remain a source of error, as they have high volume/height but zero permanent residents. Future work must integrate Land Use classification (identifying the function of a building) alongside Land Cover (identifying the existence of a building).
Looking Forward
As we move toward 2030, the availability of global high-resolution DSMs (like WorldDEM) suggests these "Volumetric" models could be deployed at a national scale to monitor urban sprawl and resource demand in real-time.