
Smart Communities & Urban Stewardship: Bridging the Gap Between Data and Perception
Smart Communities Meet Urban Management: Harnessing the Potential of Open Data and Public/Private Partnerships through Innovative E-Governance Applications
The paper introduces an innovative e-governance framework and an Internet-based mobile application designed for "Urban Stewardship." By integrating technically validated topographic databases with user-contributed geo-tagged data, the method enables real-time monitoring and maintenance of urban utilities, achieving a smarter, participatory approach to urban management.
TL;DR
This paper presents a robust e-governance framework that leverages mobile crowdsourcing to improve urban utility management. By empowering citizens as "Area Watchers," the proposed system integrates real-time human perception with official topographic databases, transforming how local governments maintain public spaces and transit systems.
The "Static Map" Problem: Why Traditional GIS Fails
Urban environments are dynamic, yet the maps used to manage them are often static. Traditional numerical cartography struggles to track transient issues—potholes, broken streetlights, or improperly dumped waste. Furthermore, automated sensors (cameras/microphones) lack the "perceptive information" that only humans can provide.
The authors argue that existing e-government tools often fail because they don't account for the Sense of Place. Without a feeling of belonging to a community, citizens have little motivation to participate in crowdsourcing.
Methodology: The Urban Stewardship Model
The core innovation is the concept of Urban Stewardship. Unlike simple reporting apps, this system relies on a structured integration of expert and lay knowledge.
1. Data Subsystems
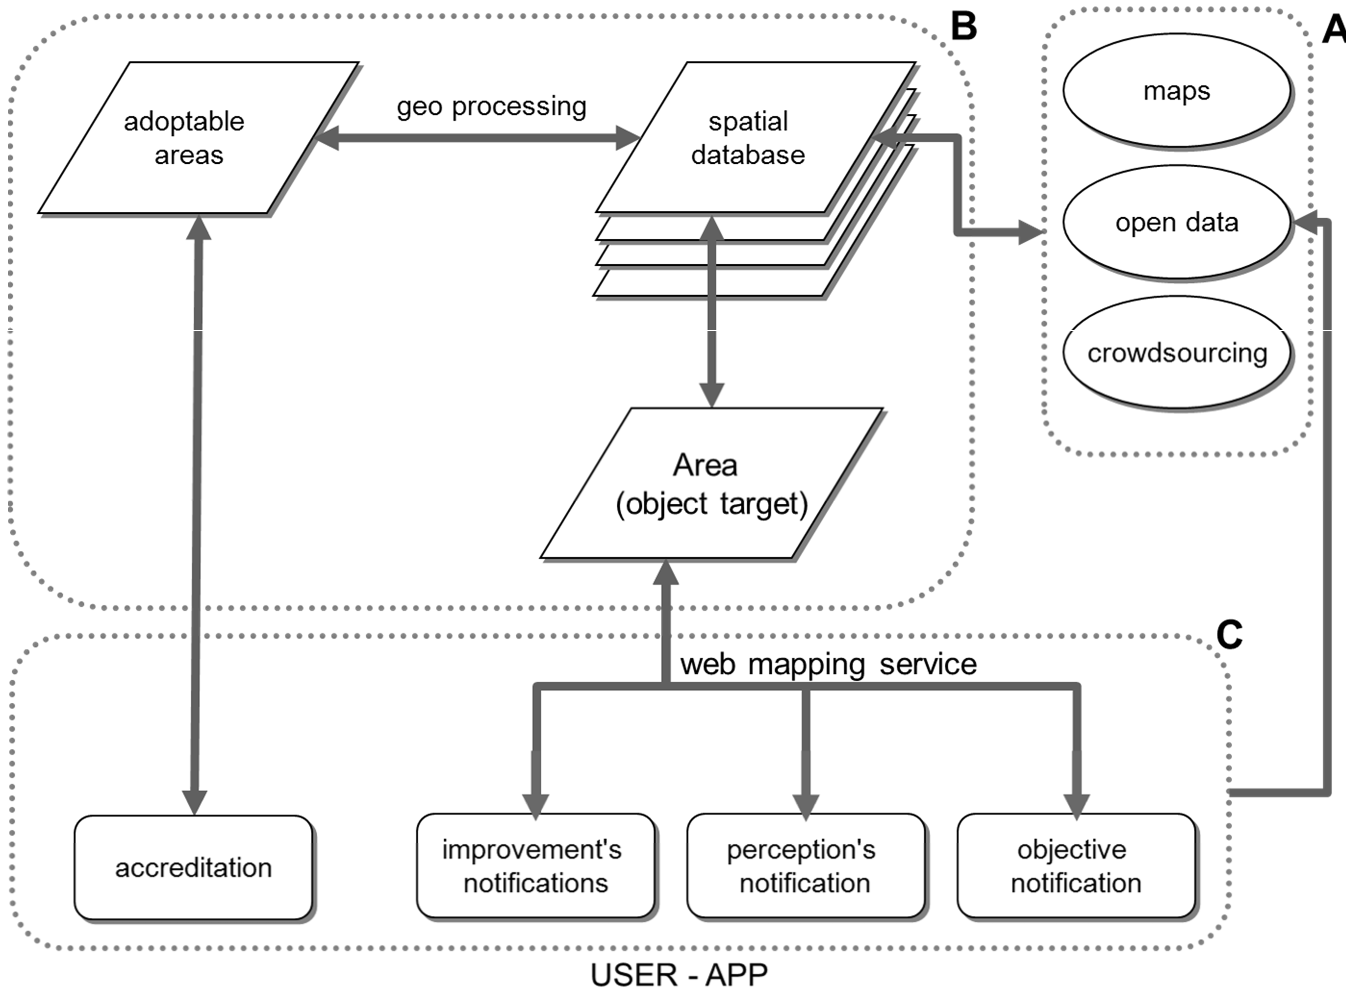
The architecture is divided into three key subsystems:
- Subsystem A (Input): Combines official digital cartography, open data services, and crowdsourced inputs.
- Subsystem B (Back Office): Manages the topological mapping and classification of "Target Territorial Objects."
- Subsystem C (Client): The user-facing mobile and web applications.
2. The Reporting Logic
To ensure data quality, the system uses a specific geo-processing workflow when a user submits a report:
- Localization: GPS identifies the user's coordinates.
- Buffering: The system creates a 20-meter radius around the user.
- Object Selection: Users select specific "Target Territorial Objects" (e.g., a specific bus stop or tree) from a pre-validated list within that buffer.
Experimental Validation: The Bari Pilot
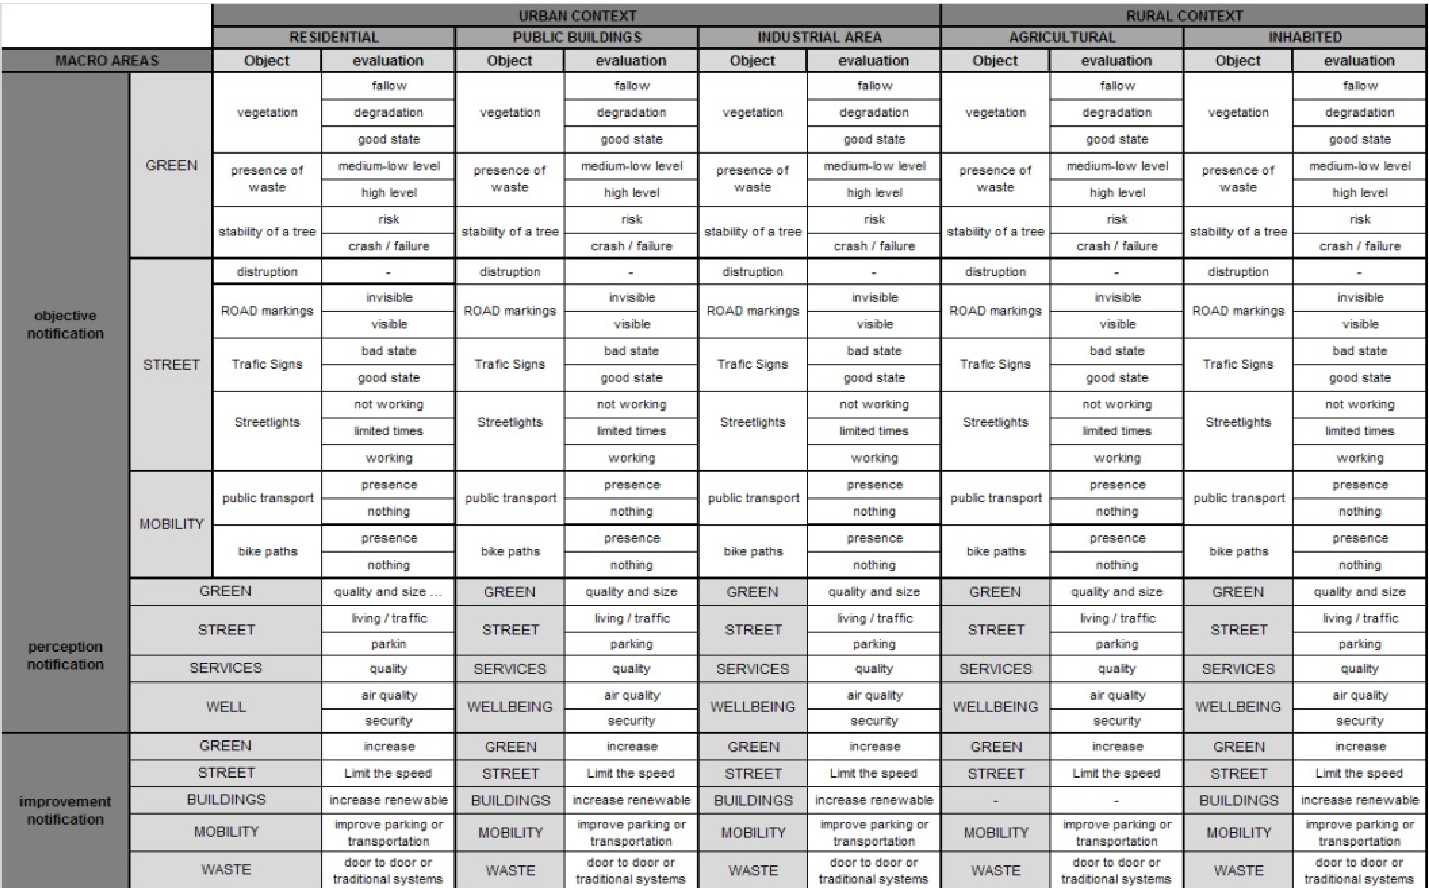
The tool was tested in the San Cataldo district of Bari, Italy. The pilot app (Android) focused on 44 distinct urban and rural contexts, ranging from residential fabric to industrial zones.
Key Categories Monitored:
- Green Areas: Vegetation health and tree stability.
- Streets: Road markings and traffic signs.
- Mobility: Public transport availability and bike paths.
- Waste: Level of trash and dumping reports.
Table: Taxonomy of Urban Objects and Evaluations
Deep Insight: Beyond "SeeClickFix"
While apps like SeeClickFix or Waze exist, this paper takes a step further by focusing on Accountability and Open Data Interoperability. By adhering to the EU INSPIRE Directive, the data collected isn't just a list of complaints; it becomes a structured feed that updates the actual official GIS of the city.
The "Why it works" factor lies in the synergy of motivation.
- For Citizens: Increased engagement and a direct channel to improve their neighborhood.
- For Authorities: Streamlined workflows and cost-effective maintenance planning.
- For Utility Companies: Better risk prevention and corporate social responsibility (CSR).
Limitations and Future Work
The authors acknowledge a critical challenge: Incentive. While "Sense of Place" is a powerful motivator, the paper suggests that subsidies or tax rebates might be necessary to ensure long-term, high-volume participation. However, there is a risk that financial rewards might undermine the perception of the city as a "common good."
Future research will focus on Instant Governance, where the feedback loop between a citizen's report and the city's response becomes near-instantaneous.
Conclusion
This work demonstrates that "Smart Cities" are not just about sensors and wires; they are about Smart Communities. By bridging the gap between official representations of the city and the lived experience of its residents, e-governance can move towards a more democratic and efficient future.