
Exponential Peaks and Local Templates: Reimagining Load Forecasting in India
The end consumers of Smart Grid have NO say in the ecosystem of electricity Grid. The price of electricity and infrastructure of grid have been solely governed by utility companies and government entities. One of the objectives of the smart grid is to bring consumer on board using IoT technologies. Peak demand is a major concern for government and utility. Since different neighborhood would have different consumption pattern and hence load forecasting model at utility level would not predict load at all neighborhood. Socio-economic activities of consumers of a particular neighborhood are coherent. Existing research on this topic considers uniform distribution of assets and uniformity in appliances and pattern of consumption hence they are not good enough for Indian condition. The behavioral pattern of user, other economic activities and different aspect of the weather affect the consumption. In this paper we analyzed the effect of socioeconomic dynamics on demand, developed forecasting mechanism and presented the results. This study reveals that the peak demand is actually growing exponentially. Moreover a unique mechanism of forecasting is presented in this paper which is a two steps process-(i) initially a template pattern of consumption is created using parametric estimation, (ii) then total consumption of the day is created using machine learning technique and (ii) finally total consumption is redistributed to deduce time of the day consumption
This paper introduces a specialized load forecasting framework for the Indian power grid at the Distribution Transformer (DT) level. It combines parametric estimation of socio-cultural consumption templates with machine learning-based weather adjustment to improve Demand Response (DR) event prediction.
TL;DR
Electricity demand in India isn't just growing; its peaks are accelerating exponentially due to the synchronized lifestyles of an urbanizing population. This paper presents a localized forecasting model at the Distribution Transformer level that combines socio-cultural "habit templates" with weather-driven regression to enable more effective Demand Response (DR) programs.
The "Synchronized Lifestyle" Trap
Traditional forecasting models often treat electricity as a commodity governed purely by linear growth. However, in India, the author identifies a critical microeconomic phenomenon: the Peak Demand is proportional to the square of GDP.
Why? Because GDP growth drives urbanization. Urbanization leads to "coherent behaviors"—thousands of people in a neighborhood going to office, returning home, and turning on ACs/TVs at the exact same time. While average demand is linear, this synchronization creates a "compounding" effect on peaks that infrastructure struggles to match.
Methodology: The Two-Step Integration
The paper argues that forecasting at the national or utility level is useless for Demand Response. Instead, we must look at the Distribution Transformer (DT) level, where weather and socio-economics are uniform.
1. Parametric Template Creation
The author categorizes days into "Weekdays," "Saturdays," and "Sundays" based on high correlation coefficients (e.g., Tuesday-Thursday correlation of 0.84).
- Filtering: Using a Gaussian plane, data points beyond a z-score of ±2 are eliminated as outliers.
- Expectation Value: The model calculates the expected consumption for each 15-minute slot to create a "social habit" template.
2. Weather Component Adjustment
Since the template only captures habits, a linear regression model is applied to adjust for temperature and humidity, which affects the total energy volume .
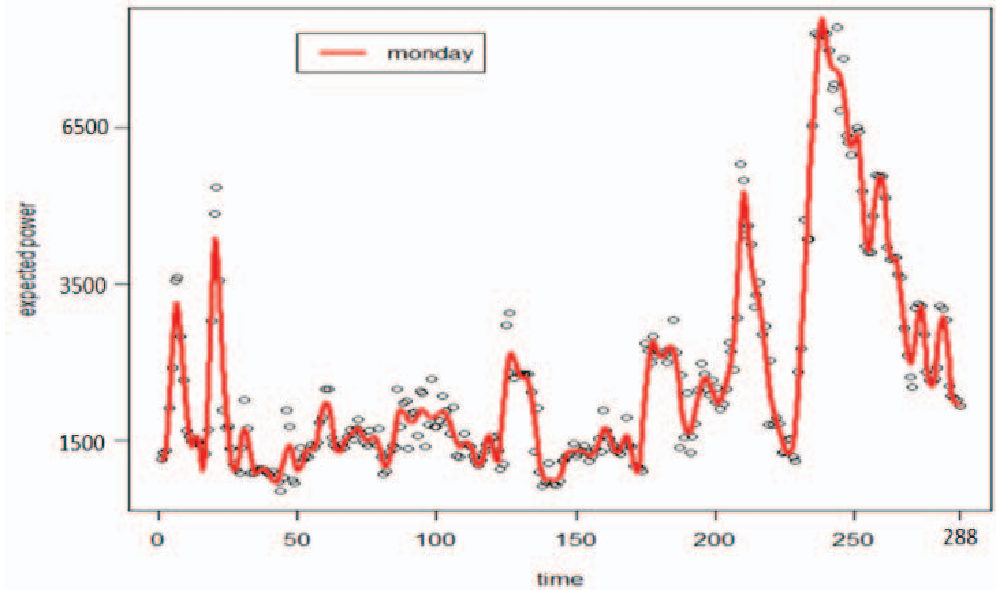 Figure 1: A typical template of the day showing late-night activity peaks in urban clusters.
Experimental Insights
The study analyzed 81 days of data from a specific transformer. The "Integrated Approach" formula is:
Key findings from the results table:
- Scale Matters: As the time resolution () increases from 5 minutes to 3 hours, the average error drops from 74% to 28%.
- The 3-hour Sweet Spot: For Demand Response, 3-hour ahead forecasting yielded a minimum error of 12%, providing a viable window for utilities to trigger load-shedding or incentive alerts.
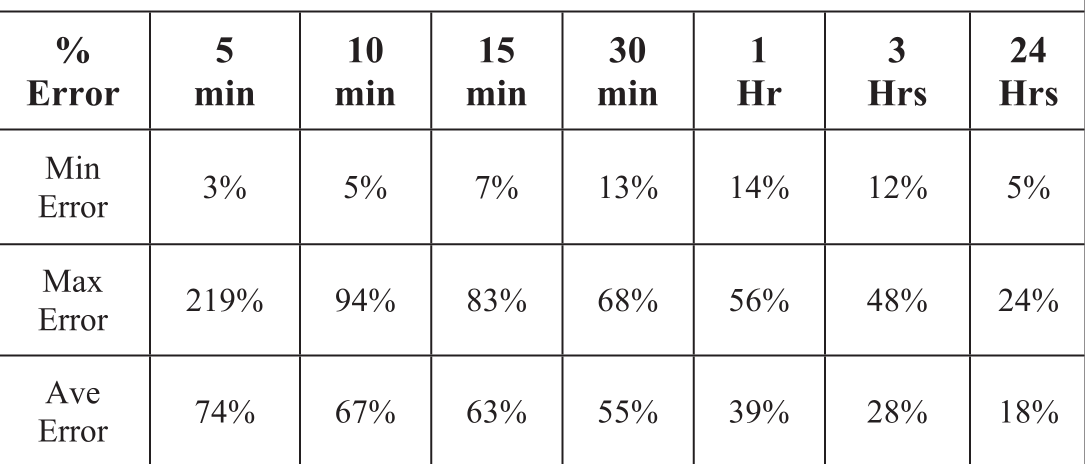 Table 1: Error analysis across different time resolutions.
Critical Analysis & Conclusion
Why this matters
The breakthrough of this paper is the mathematical proof of the Exponential Peak. By linking to , it warns policy makers that simply adding generation capacity is a losing game. We must use Demand Response to "shave" these peaks.
Limitations
The average errors (28-39%) remain high for granular control. The author notes that "erratic activities"—sudden local events or neighborly changes—at the transformer level make 100% accuracy impossible with simple statistical methods.
Future Outlook
To bring these errors down, future research should integrate IoT data from individual smart meters into the transformer-level template, allowing the model to adapt to real-time behavioral shifts rather than relying on static 15-minute historical bins.