
Smart IoT Agriculture: Predicting Crop Epidemics Before They Strike
Smart IoT Monitoring System for Agriculture with Predictive Analysis
This paper presents a smart IoT monitoring system for precision agriculture designed to predict Late Blight disease in potato and tomato crops. By integrating NodeMCU-based sensing nodes with a Raspberry Pi gateway and a machine learning pipeline, the system achieves disease prediction eight days before occurrence with a peak accuracy of 99.97%.
TL;DR
Late Blight can wipe out a potato field in under a week. This paper introduces an IoT-driven monitoring system that uses high-order Linear Regression to predict outbreaks 8 days in advance. By leveraging NodeMCU sensors and a Raspberry Pi gateway, the system achieves a staggering 99.97% accuracy, providing farmers with a critical window to save their crops using minimal pesticides.
Problem & Motivation: The Looming Threat of Late Blight
In Egypt, potato cultivation accounts for 15% of total vegetable areas, but it is under constant threat from Phytophthora infestans, the pathogen behind Late Blight. Historically, this disease was responsible for the Irish potato famine.
The current agricultural "pain point" is twofold:
- Reactive Disaster: By the time a farmer sees brown lesions, the plant is often doomed.
- Over-Chemicalization: Without precise data, farmers over-apply pesticides to be "safe," damaging the environment and increasing costs.
The authors' insight was to move away from visual detection toward climatological prediction. By monitoring the exact environmental conditions (Growing Degree Days) that allow the pathogen to thrive, they can forecast its arrival before it even touches the leaf.
Methodology: The Three-Layer Architecture
The system is built on a robust, cloud-based IoT framework designed for reliability in the field.
1. The Perception Layer (The Senses)
Using NodeMCU (ESP8266) microcontrollers, the system gathers real-time data on air temperature, humidity, soil moisture, and leaf wetness. These nodes use the MQTT protocol, a lightweight messaging standard perfect for low-bandwidth agricultural environments.
2. The Gateway Layer (The Brain)
A Raspberry Pi 3 acts as the local "Brain." It runs an MQTT broker (Mosquitto) to collect data from all nodes and performs the heavy lifting: executing the Machine Learning models.
- Algorithm Choice: While Neural Networks were considered, the authors chose Linear Regression and SVM. Why? Because they offer high accuracy with significantly lower memory and power consumption—critical for edge computing in remote fields.
3. The Application Layer (The Interface)
Data is pushed to an online MySQL database and visualized via a secure GUI. Farmers receive one of four critical alerts based on the Accumulated GDD (Growing Degree Days).
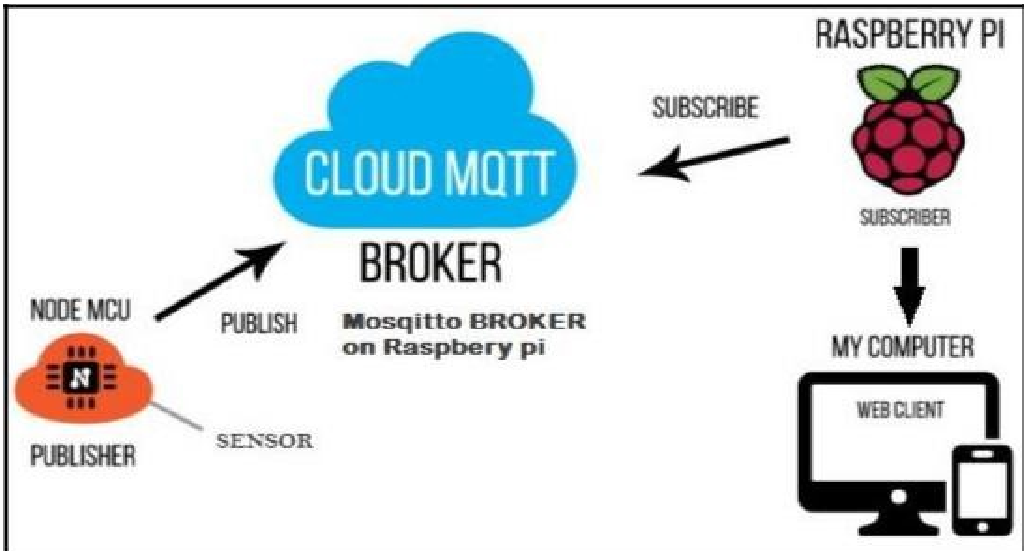 Fig 1: System architecture leveraging MQTT for seamless sensor-to-gateway communication.
The "Magic" in the Math: GDD and Regression
The core of the prediction lies in the calculation of GDD:
The researchers found that Disease Severity (DS) follows a trend that can be mapped using polynomial regression. As shown in the fits below, increasing the order of the regression allows the model to capture the non-linear "explosion" of disease spread.
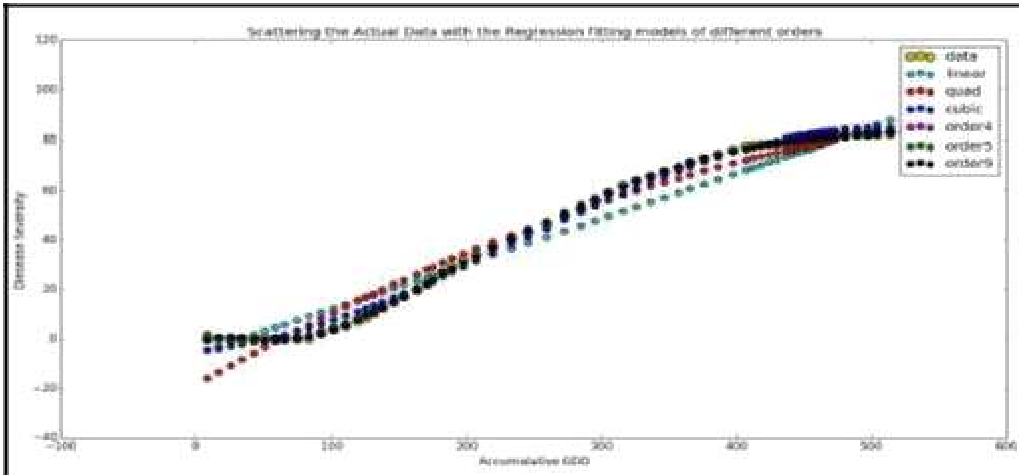 Fig 2: 9th-order fitting vs. lower-order models, demonstrating the capture of exponential disease growth.
Experimental Results
The ablation of regression orders showed a clear trend:
- Order 1 (Linear): 95.21% accuracy.
- Order 9 (Polynomial): 99.97% accuracy.
By categorizing the GDD thresholds, the system provides actionable intelligence:
- GDD < 125: Field clear.
- GDD 125–250: Apply fungicides within 10–14 days.
- GDD 250–390: Urgent! Spread expected within 5 days.
- GDD > 390: Crop likely lost (Epidemic stage).
Critical Analysis & Future Outlook
Takeaway: This work successfully bridges the gap between raw IoT data and "Expert System" advice. By focusing on predictive analytics rather than just monitoring, it transforms the farmer's role from a victim of weather to a proactive manager.
Limitations: The current system relies on Wi-Fi (NodeMCU), which may have range issues in massive industrial farms. Furthermore, it still requires human intervention to act on the warnings.
Future Work: The authors envision a "Closed-Loop" system. Imagine the gateway triggering an automated irrigation or pesticide misting system the moment the ML model detects a high-risk GDD threshold—removing human error entirely from crop protection.