
Smart Solution in Social Relationships Graphs: Tackling the Hairball Problem on Mobile
Smart Solution in Social Relationships Graphs
This paper presents "FaceTools," an Android-based visualization tool for social relationship graphs (sociograms) leveraging CmapTools. It addresses the "hairball" problem in large social networks through a custom community detection and edge-reduction algorithm to improve graph clarity.
TL;DR
Visualizing social networks on mobile devices is a notorious challenge due to limited screen real estate and processing power. This paper introduces FaceTools, an Android application that utilizes community clustering and "near-arc" packing to simplify complex Facebook sociograms. While it successfully reduces visual clutter by 22%, it highlights significant barriers in API data access and mobile performance.
Background: The Complexity of Social Graphs
In graph theory, a social network is an undirected graph . With the average Facebook user having hundreds of friends, the resulting "hairball" of edges makes it impossible to identify meaningful social structures. The authors argue that simply plotting vertices is insufficient; we need algorithms that respect the Inductive Bias of human social groups—people cluster into distinct communities (high school, work, family).
The Problem: Data Silos and Visual Noise
The authors identify two primary pain points:
- API Restrictions: The transition from FQL to the Facebook Graph API has decimated the ability of third-party apps to fetch "friend-of-friend" data.
- Visual Overload: Existing tools like TouchGraph provide a good starting point but still suffer from excessive edge-crossing, making individual relationships hard to trace in dense clusters.
Methodology: Simplifying through Subgraphs
The core innovation lies in how the authors handle "arcs" (complete subgraphs).
1. Community Detection
The algorithm iteratively unites communities where members share a threshold percentage () of friendships.
- Phase 1: Cluster pairs with no other friends.
- Phase 2: Merge groups where 60% of relationships are shared.
- Phase 3: Gradually lower the coefficient () to 5% until all nodes are assigned to a community.
2. The "Near-Arc" Visualization
Instead of drawing every edge in a dense group, FaceTools uses a "negative space" logic:
- Packing: Vertices in a community are grouped into a colored circular area.
- Inversion: Instead of showing 100 present relationships, if a group is nearly complete, the tool identifies the missing relationships and highlights them in red.
- Edge Condensing: Multiple relationships to an external community are bundled into a single representative edge.
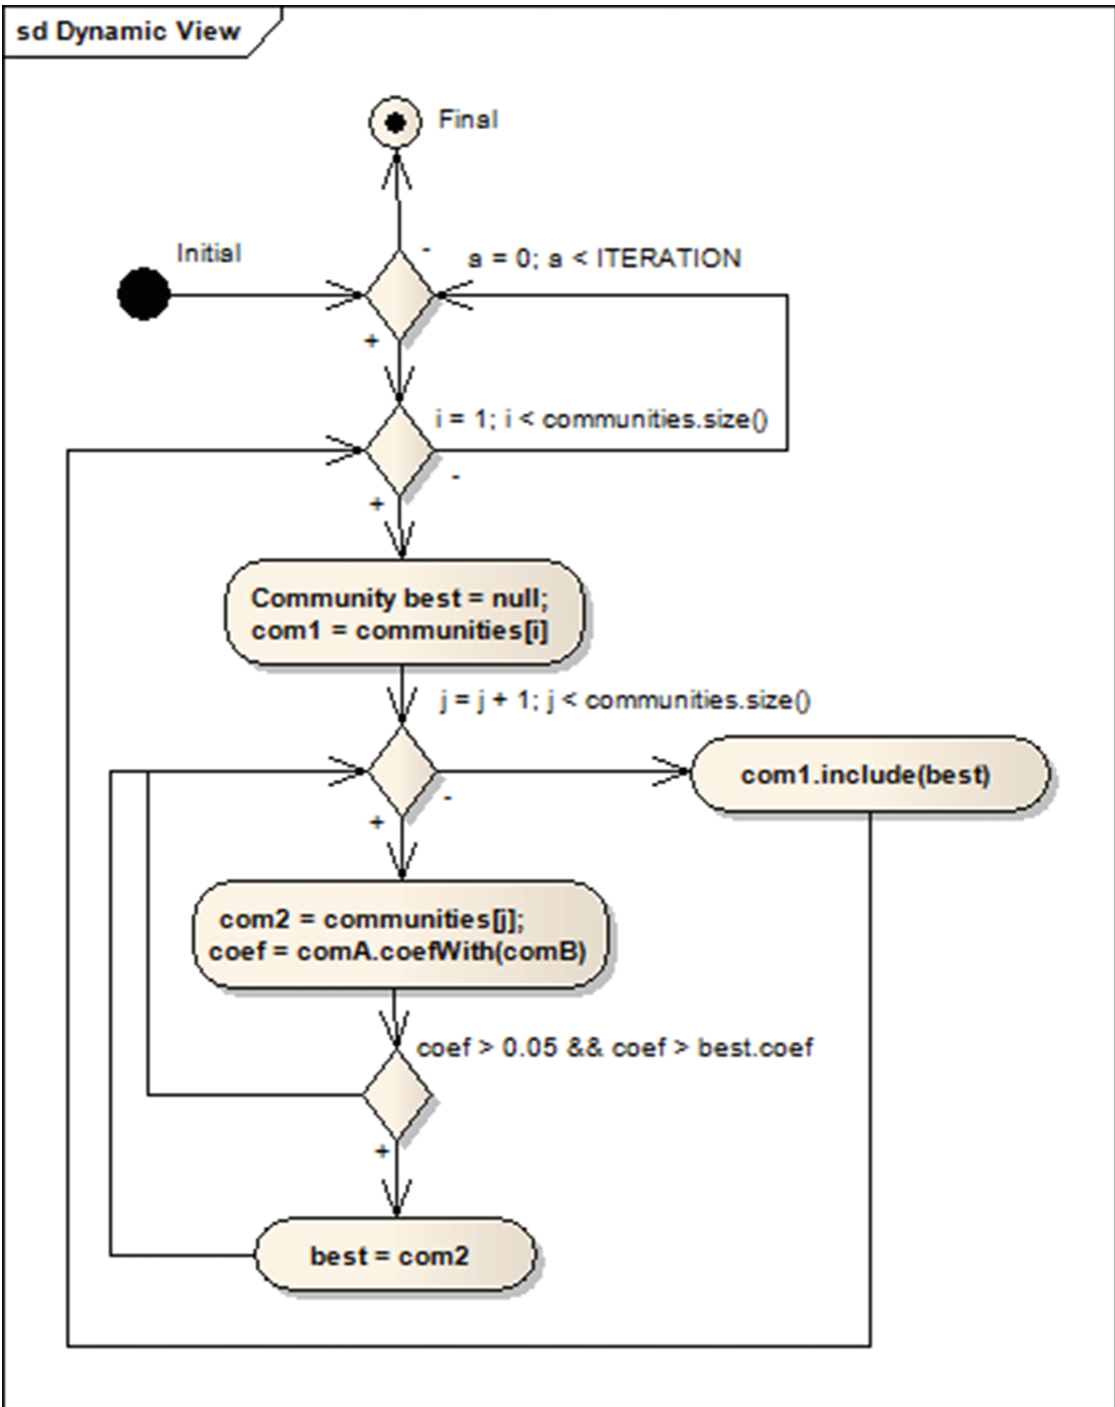 Figure 1: The flow diagram of the community joining algorithm.
Experiments and Results
The authors tested the tool on a real-world dataset of 216 friends and 1,463 relationships.
- Clarity: The algorithm reduced the number of visible "friendship" edges to 1,142 and identified 4 major communities.
- Performance: The results were mixed. On a Google Nexus 7, the calculation took 31 seconds—nearly double the time of the desktop-based TouchGraph (17 seconds).
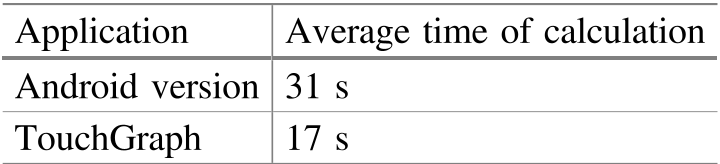 Figure 2: Computation time comparison between FaceTools and TouchGraph.
Critical Insight: The "Negative" Result
Rarely does an academic paper conclude with a "negative" assessment, but the authors are refreshingly honest. They admit the application is "not very useful" in its current state because:
- JavaScript Workarounds: To bypass Facebook's API limits, they had to use a JavaScript scraper to generate XML files, breaking the "one-click" mobile experience.
- Computational Burden: The recursive clustering logic is too heavy for standard mobile CPUs of the era, leading to a laggy UI.
Conclusion and Future Outlook
This work serves as a vital case study in the gap between graph theory and mobile UX. While the "negative" edge logic (marking missing links) is a clever way to reduce visual entropy, the study proves that without open data APIs, sophisticated social visualization tools cannot thrive. For future researchers, the focus should likely shift toward Privacy-Preserving Local Graph Processing or using Graph Neural Networks to offload the layout computation to specialized hardware.
Takeaway for Architects
When designing mobile graph tools, "What you don't show" is as important as "What you show." Bundle your edges, group your nodes, and always monitor your big-O complexity on ARM architectures.