
Digital Phenotyping: Mapping Social Networks via Smartphones to Predict Mental Health
Interpersonal relationships are necessary for successful daily functioning and wellbeing. Numerous studies have demonstrated the importance of social connectivity for mental health, both through direct peer-to-peer influence and by the location of individuals within their social network. Passive monitoring using smartphones provides an advanced tool to map social networks based on the proximity between individuals. This study investigates the feasibility of using a smartphone app to measure and assess the relationship between social network metrics and mental health. The app collected Bluetooth and mental health data in 63 participants. Social networks of proximity were estimated from Bluetooth data and 95% of the edges were scanned at least every 30 minutes. The majority of participants found this method of data collection acceptable and reported that they would be likely to participate in future studies using this app. These findings demonstrate the feasibility of using a smartphone app that participants can install on their own phone to investigate the relationship between social connectivity and mental health
This study presents a custom smartphone application designed for passive social network mapping via Bluetooth proximity sensing to investigate correlations with mental health. By deploying the app on participants' personal devices (both iOS and Android), the researchers successfully achieved high-resolution network monitoring, marking a significant step toward scalable digital phenotyping in mental health.
TL;DR
Researchers have developed a custom smartphone app that utilizes Bluetooth proximity sensing to objectively map social interactions. Unlike previous studies requiring specialized hardware, this "Bring Your Own Device" (BYOD) approach works across both iOS and Android, achieving high participant acceptability and providing a scalable method to study the link between social isolation and mental health indicators like depression and anxiety.
Background & Motivation: Beyond Self-Reports
Interpersonal relationships are the bedrock of psychological well-being. Historically, researchers have measured "social connectivity" through name generators and surveys. However, these methods suffer from recall bias—depressed individuals might underestimate their social interactions, while others might over-report activity due to social desirability.
The technical challenge has been capturing face-to-face proximity at scale. While previous attempts used sensors, they often required distributing pre-configured phones (e.g., Nokia or specialized Android builds), which is logistically impossible for large-scale epidemiological studies. This paper addresses the "scalability vs. accuracy" trade-off by building a tool for the devices people already carry.
Methodology: The Logic of Proximity
The core of the system is a passive Bluetooth discovery scan performed every five minutes. When device A detects device B, it implies a physical proximity of 5–10 meters—a valid proxy for social interaction in a workplace setting.
Quantifying the Network
To account for the fact that phones might miss each other due to battery saving or background restrictions, the authors used a normalized connection strength formula:
This ensures that the weight of a social "edge" is relative to the total number of successful scans, preventing the data from being skewed by devices with lower scanning frequencies.
 Figure: Bluetooth scanning rates for individual devices (top) and social edges (bottom), showing that combined device data increases network resolution.
Experimental Insights
The study was conducted within a data analytics company in Sydney with 63 participants.
- Mental Health Distribution: Most participants reported minimal to mild symptoms of depression (PHQ-9) and anxiety (GAD-7), but a small percentage showed severe clinical levels.
- The iOS Challenge: A significant hurdle was the "closed" nature of iOS. The team had to use private APIs and the ResearchKit framework to ensure the app could function in the background, though Android still yielded higher raw scanning rates (55% vs. 29%).
- Network Clustering: By applying a "disparity filter," the researchers extracted a backbone network. Preliminary visualization (Figure 3 in the paper) suggests that individuals with higher depression scores tended to cluster or occupy specific positions in the network, though larger samples are needed for statistical significance.
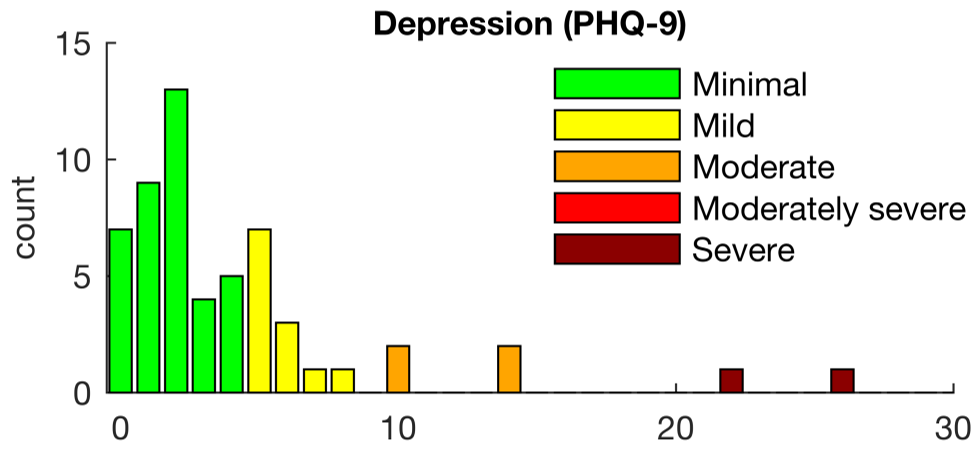 Figure: Distribution of PHQ-9 (Depression) and GAD-7 (Anxiety) scores among the study population.
User Experience and Privacy
A critical finding was the high level of participant acceptance. 92% of users felt the impact on their privacy was minimal, and most reported negligible impact on battery life. The 15% drop-out rate is remarkably low for a study involving passive background tracking, suggesting that users are willing to trade some data for mental health insights.
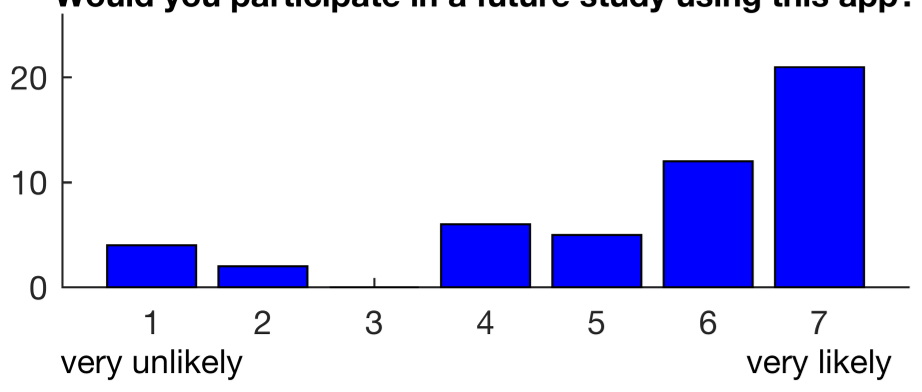 Figure: Survey results indicating high willingness for future participation and low perceived privacy intrusion.
Critical Analysis & Future Outlook
While this study proves feasibility, it highlights the technical friction between privacy-focused mobile OS (like iOS) and researchers. The inconsistent scanning patterns between Android and iOS represent an "Inference Bias" that must be corrected through better statistical weighting.
Takeaway: This work paves the way for a "methodological paradigm shift." If we can objectively detect social withdrawal (the reduction in frequency/duration of proximity events) in real-time, we can potentially intervene before a depressive episode or a suicidal crisis occurs. The future of mental health isn't just in the clinic—it's in the pocket.