
Decoding the DNA of QQ: A Billion-Scale Empirical Study on Social Attributes
Social Community-Oriented Social Attribute Analysis: An Empirical Study on QQ Group Data
This empirical study provides a large-scale statistical analysis of social attributes in the QQ network, utilizing a massive dataset of 1.4 billion personal profiles and 80 million group profiles. The research identifies that user age follows a normal distribution, while the size of social communities (QQ groups) strictly adheres to a power-law distribution.
TL;DR
This study presents a systematic statistical analysis of one of the world's largest social datasets: 1.4 billion personal profiles and 80 million groups from QQ. The researchers move beyond small-scale surveys to prove that social life online isn't random—it follows strict mathematical patterns, specifically Normal distributions for age and Power-law distributions for community sizes.
Perspective: Moving Beyond Questionnaires
For years, social network analysis (SNA) was hamstrung by data scarcity. Researchers often relied on questionnaires from a few hundred participants to draw conclusions about millions. This paper changes the scale entirely. By analyzing the "Big Data" of QQ, the authors provide a high-fidelity snapshot of social dynamics, addressing a critical gap: the lack of systematic research on how virtual communities (groups) are structured.
The Hidden Math of Social Profiles
The authors discovered that human demographics in a digital space are remarkably consistent.
1. The Age Bell Curve
By applying curve fitting to 1.4 billion data points, the study found that user age distribution is not skewed but follows a classic Normal Distribution. Despite the lack of strict age validation on the platform (leading to some "100-year-old" outliers), the core user base remains concentrated between 18 and 40 years old.
2. Validating the Samples
How do we know the findings aren't just a fluke of the specific data slice? The authors used Kullback-Leibler (KL) Divergence to measure "information loss." With a KL distance consistently under 0.1, they mathematically proved that their samples are highly representative of the entire integrated QQ network.
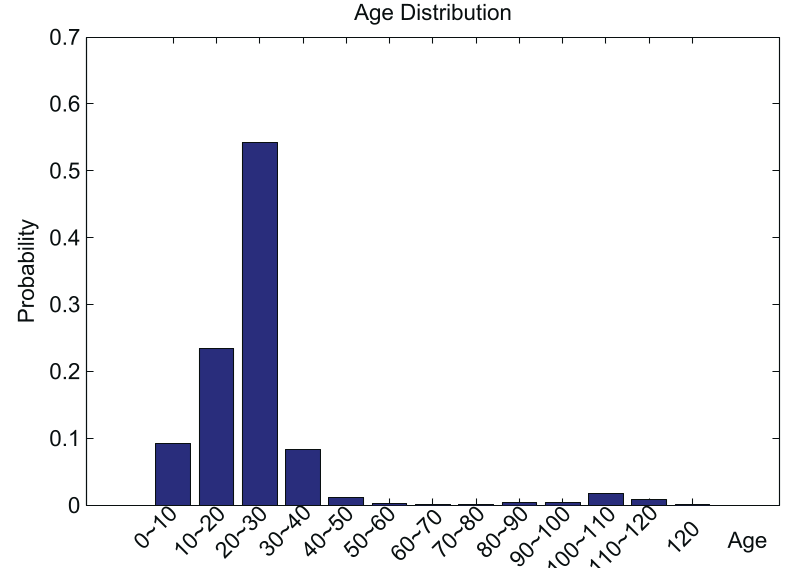 Figure: The Age Distribution achieves a 97.73% correlation with the Normal Distribution model.
Methodology: The Power-Law of Communities
Perhaps the most significant finding relates to QQ Groups. While individuals might follow a bell curve for age, the groups they form follow the Power-Law, a hallmark of "scale-free" networks.
- The "Long Tail" of Groups: Mapping the number of users per group revealed a steep curve. Most groups are small (under 50 members), facilitating intimate or high-frequency interaction.
- The Hubs: A tiny percentage of groups have massive memberships (100+), acting as the "hubs" of information flow.
- Statistical Significance: The power-law fit reached an impressive 99.26% correlation coefficient, confirming that social community formation in QQ is a self-organizing process similar to the structure of the World Wide Web or scientific citation networks.
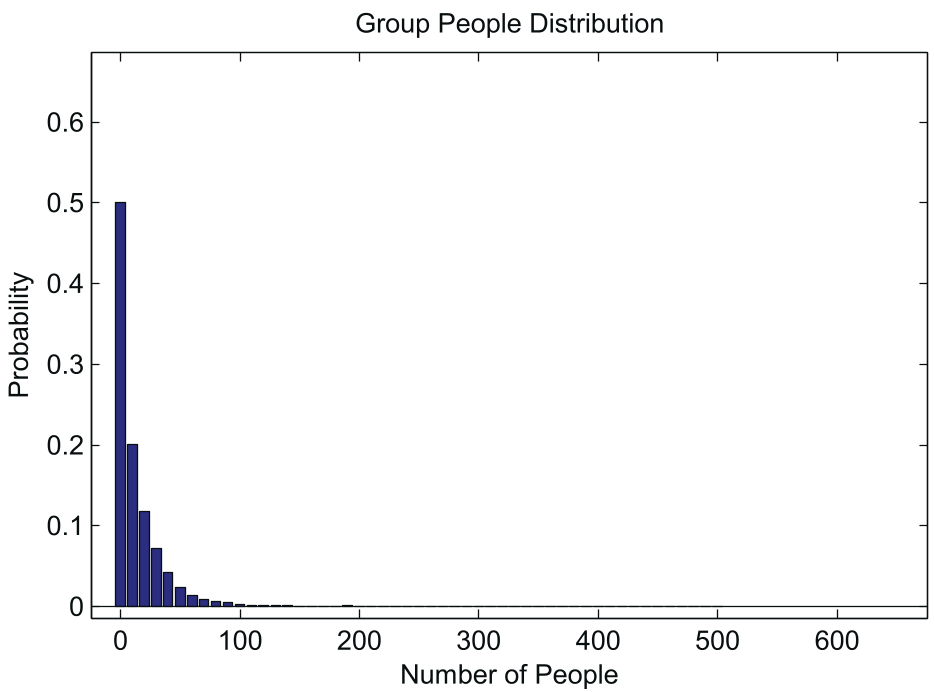 Figure: The distribution of user numbers in QQ groups, demonstrating a clear power-law architecture.
Critical Insight: Why This Matters
The discovery that community sizes follow a power-law distribution has deep implications for Social Computing:
- System Optimization: Engineers can prioritize resources for smaller, high-activity groups which constitute the bulk of the network.
- Marketing & Influence: Understanding that age distribution is normal allows for precise demographic targeting, while the power-law in groups identifies where "opinion leaders" are likely to emerge.
- Network Resilience: Scale-free networks (power-law) are notoriously robust against random failures but vulnerable to targeted "attacks" on high-degree hubs.
Conclusion
This empirical study serves as a foundational map for the QQ ecosystem. It transitions social attribute analysis from a "sociological survey" to a "data science" discipline. While the data is from a specific era (2011 context), the mathematical methodologies—particularly the use of KL Divergence for sample validation—remain a gold standard for researchers handling modern petabyte-scale social graphs.
Limitations: The study identifies outliers (0-10 and 100+ years old) resulting from lack of input validation, suggesting that "digital noise" must always be accounted for in massive SNS datasets.