
Deciphering the Pulse of the City: GeoSOMs and Factorization Machines for Urban Prediction
SPECIAL SECTION ON SOCIAL COMPUTING APPLICATIONS FOR SMART CITIES
This paper introduces a multidimensional framework for urban regionalization and Point-of-Interest (POI) location prediction using geosocial data from Twitter and Foursquare. It combines Geo-Self-Organizing Maps (GeoSOMs) with contiguity-constrained hierarchical clustering and Factorization Machines to identify homogeneous social interaction regions and estimate optimal locations for new urban facilities across three global cities: Amsterdam, Boston, and Jakarta.
TL;DR
In a world where administrative boundaries are often arbitrary, this research leverages the "digital footprints" of social media to redraw city maps based on actual human behavior. By combining Geo-Self-Organizing Maps (GeoSOMs) with Factorization Machines (FMs), the authors not only identify clusters of social interaction in Amsterdam, Boston, and Jakarta but also accurately predict where the next restaurant or hotel should be located.
The Motivation: Why Administrative Maps Fail
Traditional urban planning is trapped in static boxes. Census tracts and postcodes are designed for mail delivery or tax collection, not for understanding how a city "breathes." This leads to the Modifiable Areal Unit Problem (MAUP), where changing the boundaries of an area fundamentally changes the statistical results.
The authors argue that a city is defined by social interactions, which are 4-dimensional:
- Spatial: Where is it happening?
- Temporal: When is it happening?
- Topical: What are they talking about? (Activities)
- Demographic: Who is doing it? (Residents vs. Tourists)
Methodology: The "Geo-Neural" Approach
1. Geo-Self-Organizing Maps (GeoSOM)
The core challenge is balancing geographic proximity with attribute similarity. If you only cluster by location, you get neighborhoods; if you only cluster by attributes, you get disconnected points.
The GeoSOM introduces a "geographic tolerance" parameter (). It finds the Best Matching Unit (BMU) for a data point by first looking at a geographic vicinity and then optimizing for attribute similarity (like age or topic). This ensures the resulting clusters are spatially contiguous yet characteristic of a specific social vibe.
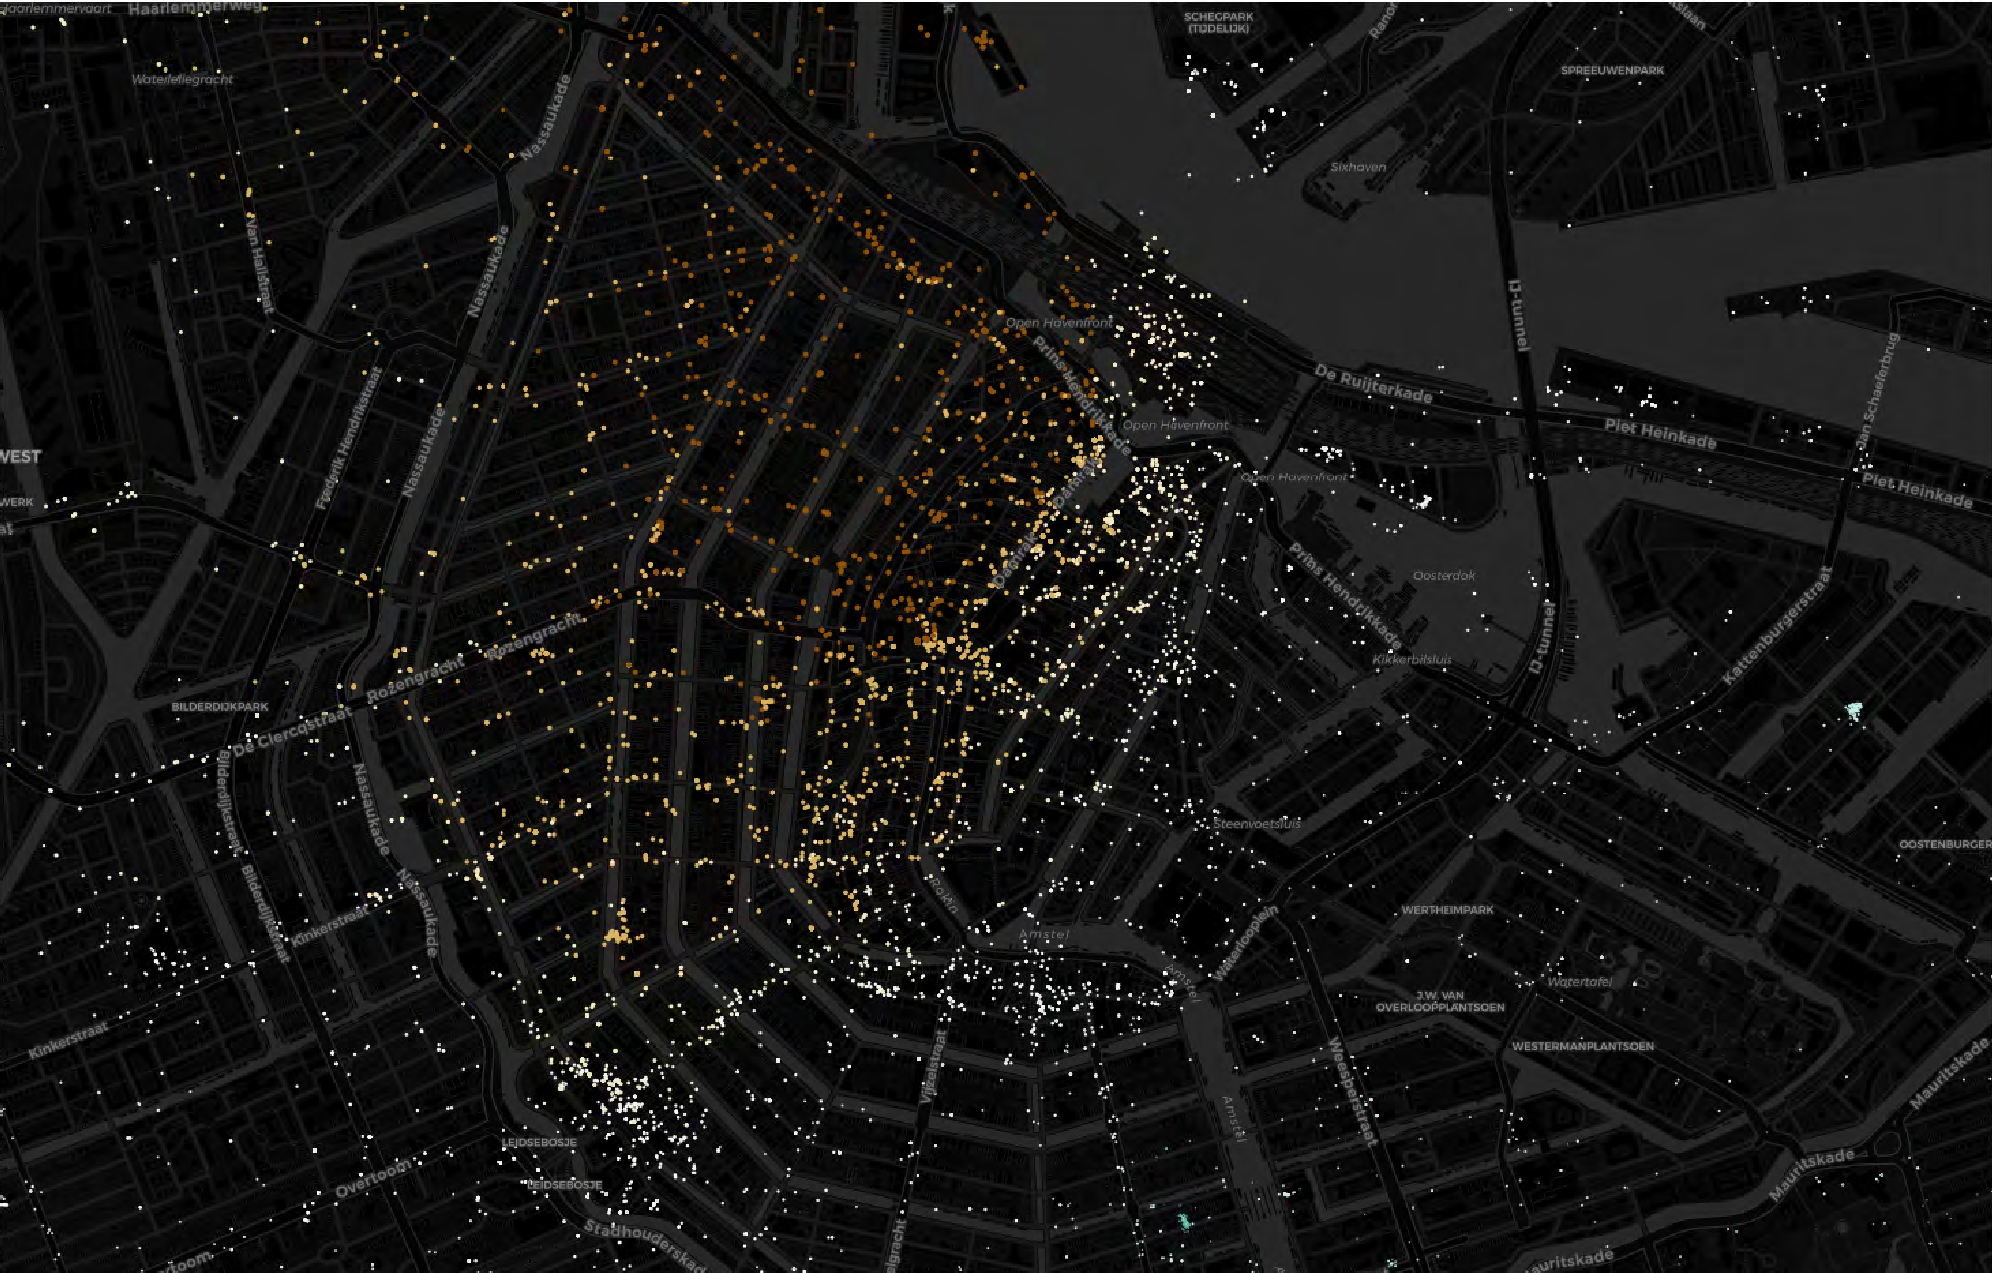 Figure: GeoSOM clusters in Amsterdam, showing how demographic and activity data reorganize the urban fabric.
2. Identifying "Third Places"
The study focuses on Third Places—environments like cafes and parks where people socialize outside of home and work. By using Latent Dirichlet Allocation (LDA), the researchers extracted latent topics from tweets (e.g., "Leisure/Outdoor" vs. "Traffic/Business") to characterize these locations.
3. Factorization Machines for POI Prediction
Predicting a POI location is a "sparse" problem. There are thousands of categories but only one for each venue. Standard Logistic Regression fails here. The authors used Factorization Machines (FMs), which model the interactions between features (e.g., "how does being a 'Tourist' interact with 'Museum' areas?") using latent vectors.
Experimental Results: The Power of Social Regions
The team tested their framework on Amsterdam, Boston, and Jakarta. The results were clear:
- Accuracy Boost: Factorization Machines outperformed Logistic Regression (LR) by roughly 9-14%.
- Region Value: Adding the "Discovered Regions" as a feature provided a statistically significant boost to the FM model’s performance.
- Urban Insights: In Amsterdam, the algorithm correctly identified that restaurants thrive in high-visit areas outside the immediate city center, while hotels are strictly center-bound.
 Table: Comparison of prediction models. Note that the FM + Region configuration achieves the highest F-scores across all cities.
Critical Analysis & Future Outlook
While the study is a breakthrough in using unstructured data, it acknowledges a significant Demographic Bias. Social media users skew younger. Therefore, the "regions" identified represent the young adult's city, not necessarily the elderly's.
What's next? The authors propose integrating morphological features—actually looking at the street-view images—to see if the physical beauty of a street correlates with the digital "buzz" recorded on Twitter.
Takeaway for the Industry
For urban developers and retailers, this research proves that "where people are" is less important than "what kind of social region they are in." Static postcodes are dead; dynamic, geosocial-aware models are the new gold standard for site selection.