
Deciphering the Crowd: Social Conformity and Price Dynamics in Simulated Stock Markets
Social Conformity and Price Fluctuation in Artificial Stock Market
This paper introduces an Artificial Stock Market (ASM) based on an asynchronous cellular automaton to simulate investor behavior and price fluctuations. By modeling social conformity through a directed graph of dependency, the study specifically mimics the order-driven trading regulations of the China Stock Market and achieves a correlation between social network topology and price momentum via R/S analysis.
TL;DR
This research explores how the "herd mentality" shapes stock market movements. By building an Artificial Stock Market (ASM) using asynchronous cellular automata, the authors demonstrate that the structure of social networks—how investors influence one another—directly dictates whether market prices will follow a persistent trend or enter a state of volatile anti-persistence.
The Architecture of Influence
Traditional finance often treats investors as rational, independent atoms. However, in reality, especially in the era of financial blogs and social media, decisions are deeply interconnected. This paper identifies two fatal flaws in prior models:
- Rule Mismatch: Most models use Western "quote-driven" rules, ignoring the "order-driven" mechanism typical of Chinese markets.
- Static Networks: Social influence is usually modeled as a fixed grid, whereas real-world influence is fluid and merit-based.
Methodology: The Asynchronous CA Approach
The core of the model is a quintuple-defined Asynchronous Cellular Automaton (). Unlike standard CAs where everyone moves in lockstep, this model mirrors the real world: news reaches people at different times.
1. The Prediction Engine
Investor state () transition is governed by two forces:
- Technical Analysis: Using BIAS and MACD to calculate a deviation rate ().
- Social Pressure (Herd Behavior): A weight () determines how much an investor trusts their own analysis versus the "neighborhood" average.
2. Evolving Social Networks
The dependency graph isn't static. It evolves based on:
- Historical Stickiness: Popular "influencers" stay popular.
- Profit Orientation: Investors gravitate toward those who made the most money in previous cycles.
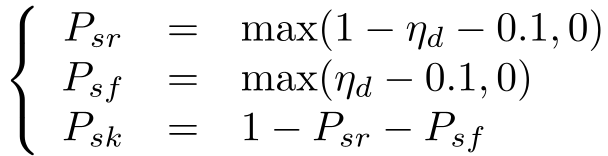 Above: High η_d leads to an adverse prediction, demonstrating the technical analysis component.
Experimental Insights: Trend vs. Chaos
The researchers used R/S Analysis to derive the Hurst Exponent (), a measure of market "memory."
- The Persistence Zone (): When investors maintained a degree of self-decision (lower ), the market showed a clear trend. The price movement today positively correlates with tomorrow.
- The Anti-Persistence Zone (): When everyone follows the crowd (high ), the market becomes "mean-reverting" or volatile. Because everyone reacts identically to the same signal, liquidity dries up or causes massive price swings.
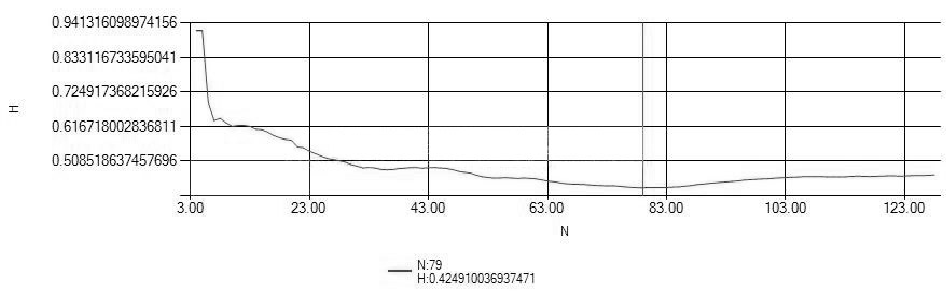 Figure 1: When profit orientation and historical stickiness are balanced (ω=0.4), the influence degree is wider, fostering diverse interactions.
Critical Analysis & Conclusion
The most profound takeaway from this work is the Paradox of Information. For a market to be "liquid," investors must disagree. If social conformity becomes too high—if we all read the same blog and follow the same "guru"—we stop trading with each other effectively, leading to high-frequency volatility.
Limitations
While the model captures the "macro" dynamics of the China stock market well, it simplifies investor psychology to a probabilistic rise/fall state. Future work could incorporate Reinforcement Learning for agents to discover more complex trading strategies beyond simple technical analysis.
The Bottom Line
This paper serves as a technical warning: a healthy market requires Inductive Bias variety. Social networks that consolidate everyone into a single "hive mind" (high conformity) are the primary drivers of market instability.