
Social Interaction Discovery: Decoding Human Ties via WiFi Proximity and Multiagent Simulation
Social Interaction Discovery: A Simulated Multiagent Approach
The paper introduces a two-phase framework for Social Interaction Discovery using a multiagent simulation in NetLogo. It utilizes simulated WiFi Received Signal Strength (RSS) data to group individuals via clustering algorithms (k-means, k-medoids, and DBSCAN) and subsequently constructs social networks to identify potential physical interactions.
TL;DR
Can we predict who is friends with whom just by looking at how they move through a WiFi-covered building? This paper explores this by simulating a university environment in NetLogo, capturing simulated WiFi signal data, and using clustering algorithms to reconstruct social networks. The study finds that k-medoids is a powerful tool for grouping individuals based on shared mobility patterns, achieving high accuracy even in dynamic settings.
Background & Motivation
Physical proximity is one of the strongest indicators of social interaction. However, tracking this in the real world is messy. Traditional GPS is often unavailable indoors, and "radio mapping" (fingerprinting a building’s signal strength ahead of time) is labor-intensive and fails as soon as furniture is moved or access points change.
The authors argue for a more flexible approach: Similarity of mobility patterns. If two people see the same WiFi Access Points (APs) with similar Signal Strength (RSS) over a period of time, they are likely walking together or interacting. To test this without the privacy hurdles of real-world data, they built a sophisticated NetLogo simulation.
Methodology: From Raw Signals to Social Graphs
The proposed methodology follows a clean, two-phase pipeline:
1. The Multiagent Simulation
The authors simulated a "University-like" world. They didn’t just move dots randomly; they programmed specific behaviors:
- Static Groups: People staying in one place (e.g., a classroom).
- Follow-the-Leader: Groups moving together, simulating friends walking to lunch.
- Random Walkers: Individuals moving independently.
To make it realistic, they used a Signal Propagation Model with added Gaussian noise, simulating the interference and signal degradation found in real buildings.
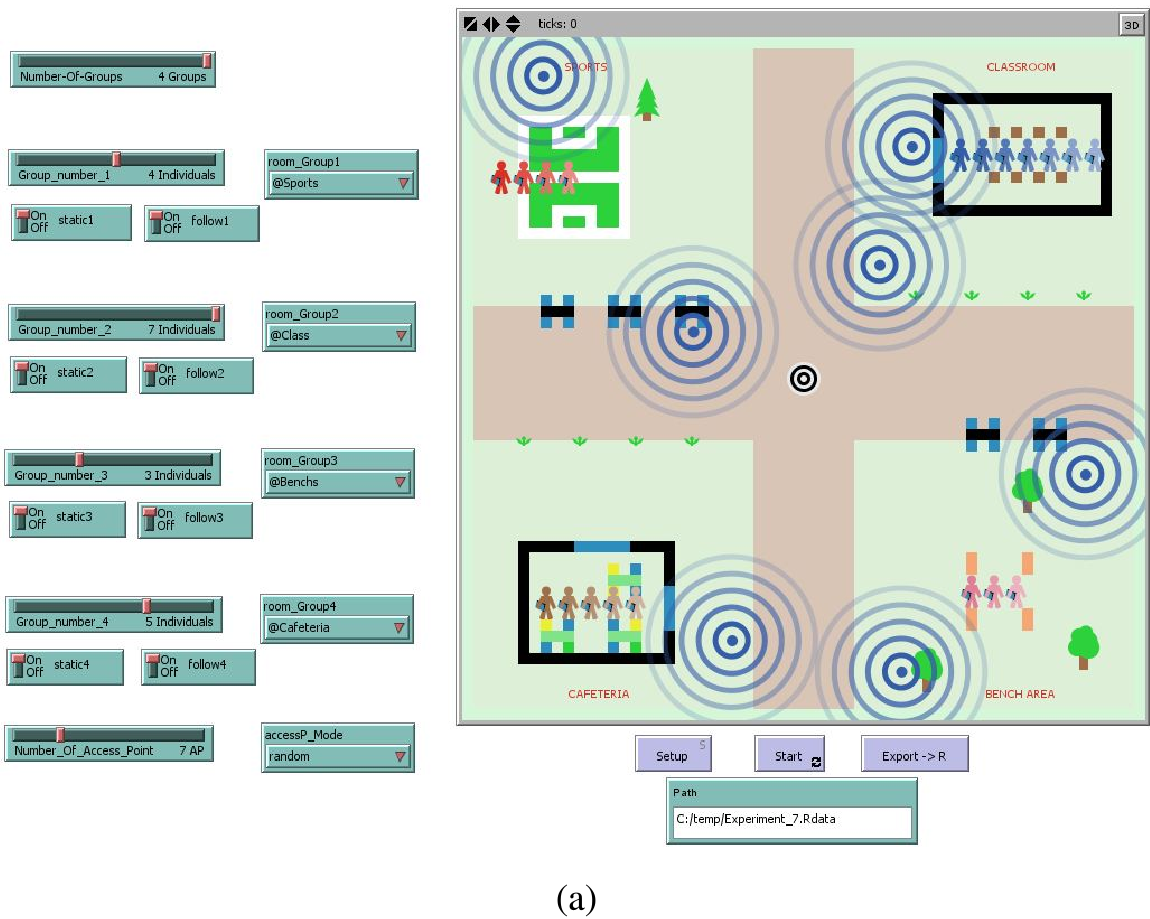 Figure 1: The workflow of data collection and similarity assumption.
2. Clustering and Network Construction
The core of the discovery process involves three unsupervised learning algorithms:
- k-means: The baseline, requiring a pre-defined number of groups ().
- k-medoids (PAM): More robust to outliers and, in the R implementation used, capable of estimating automatically.
- DBSCAN: A density-based algorithm that groups points that are closely packed together.
Once clusters are identified, the authors use the igraph package to visualize them as social networks, where an edge exists between individuals if they consistently belong to the same mobility cluster.
Experimental Insights
The researchers ran 16 different experiments varying the number of agents and their movement patterns.
The Performance Leaderboard
The results showed a clear winner in terms of accuracy:
| Algorithm | Average Error Rate | Avg. Execution Time |
|---|---|---|
| k-medoids | 0.209 | 4.902s |
| k-means | 0.246 | 4.669s |
| DBSCAN | 0.336 | 4.642s |
While all algorithms were fast (under 5 seconds), k-medoids was the most effective at identifying the "ground truth" groups.
The Visual Evidence
The power of the approach is best seen in the social network visualizations. In Experiment 8 (a controlled environment with 4 distinct groups), all algorithms performed well. However, in Experiment 16 (more random movement), DBSCAN failed to find the clusters entirely, whereas k-means and k-medoids successfully identified the social ties formed when agents congregated in common areas like the cafeteria.
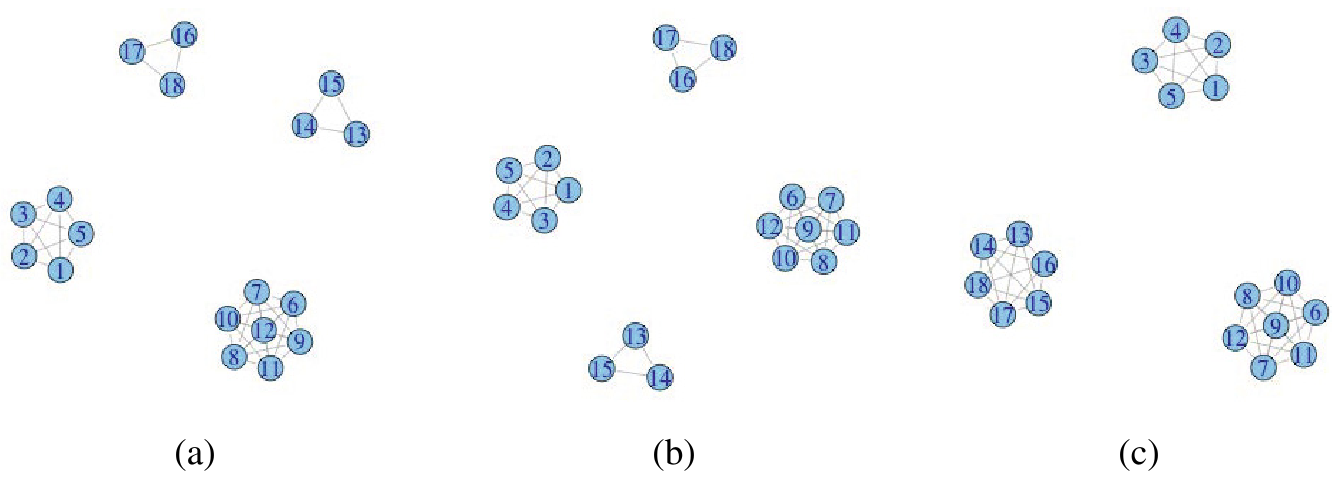 Figure 2: Social Network construction for Experiment 8. (a) k-means, (b) k-medoids, (c) DBSCAN.
Critical Analysis & Takeaways
The brilliance of this work lies in its simplicity. By focusing on relative signal similarity rather than absolute trilateration (exact GPS coordinates), the system becomes:
- Robust: It handles noisy signals well.
- Real-time Capable: The clustering is fast enough for live monitoring.
- Environment Agnostic: No need for a "radio map" of the building.
Limitations
A notable "blind spot" identified by the authors is the Lack of Signal Coverage. If agents move through a "dead zone" for a long time, the algorithm treats their missing signals (values of 0) as a form of similarity, potentially grouping strangers together simply because they are both in the dark.
Conclusion
This paper demonstrates that movement is a "social fingerprint." By using k-medoids on WiFi proximity data, we can accurately discover social structures within a population. Future work will likely involve merging this with real-world sensor data (Bluetooth, GPS) and online social media metadata to create a truly holistic "Interaction Discovery" engine.