
Social Landscapes: Reimagining Social Connections as Living Scenery
Social Landscapes: Visual Interface to Improve Awareness in Human Relationships on Social Networking Sites
This paper introduces Social Landscapes, a 3D visual interface designed to enhance user awareness of social relationships and activity histories within Social Networking Sites (SNS). By utilizing a "Pillar Shaped Timeline" (PST) metaphor, the system visualizes diary postings, login status, and inter-user comments as dynamic landscape scenery rather than traditional abstract graph nodes.
TL;DR
In an era where social media feeds are cluttered with text and notifications, Social Landscapes proposes a 3D visual paradigm that turns your social circle into a digital landscape. By replacing abstract links with "Pillar Shaped Timelines," the system helps users intuitively sense the activity levels and relationships of their friends, moving beyond information retrieval to true social awareness.
Background: Beyond the "Spider Web" of Social Data
Traditionally, Social Network Analysis (SNA) has treated friendships as nodes and edges—mathematical abstractions used for global structure analysis. While useful for researchers, these "spider webs" do little for the average user who wants to know: "Who has been active lately?" or "How has my relationship with a specific friend evolved?"
The authors argue that existing tools focus too much on analysis from the outside rather than reflection from the inside. Social Landscapes aims to bridge this gap by prioritizing "Self-Realization" and "Awareness."
Methodology: The Pillar Shaped Timeline (PST)
The brilliance of Social Landscapes lies in its 3D encoding of quantitative data. A user's profile is transformed into a Pillar Shaped Timeline (PST), which functions as a vertical diary of their digital life.
Core Visual Mapping:
- Height/Segments: Represent the volume and frequency of diary postings over time.
- Color Intensity: A dynamic signal of presence. Bright colors signify a user was active within the last hour, while darker shades indicate inactivity for over 48 hours.
- Base Shadows: The circular area at the base of a pillar represents the user's total network size.
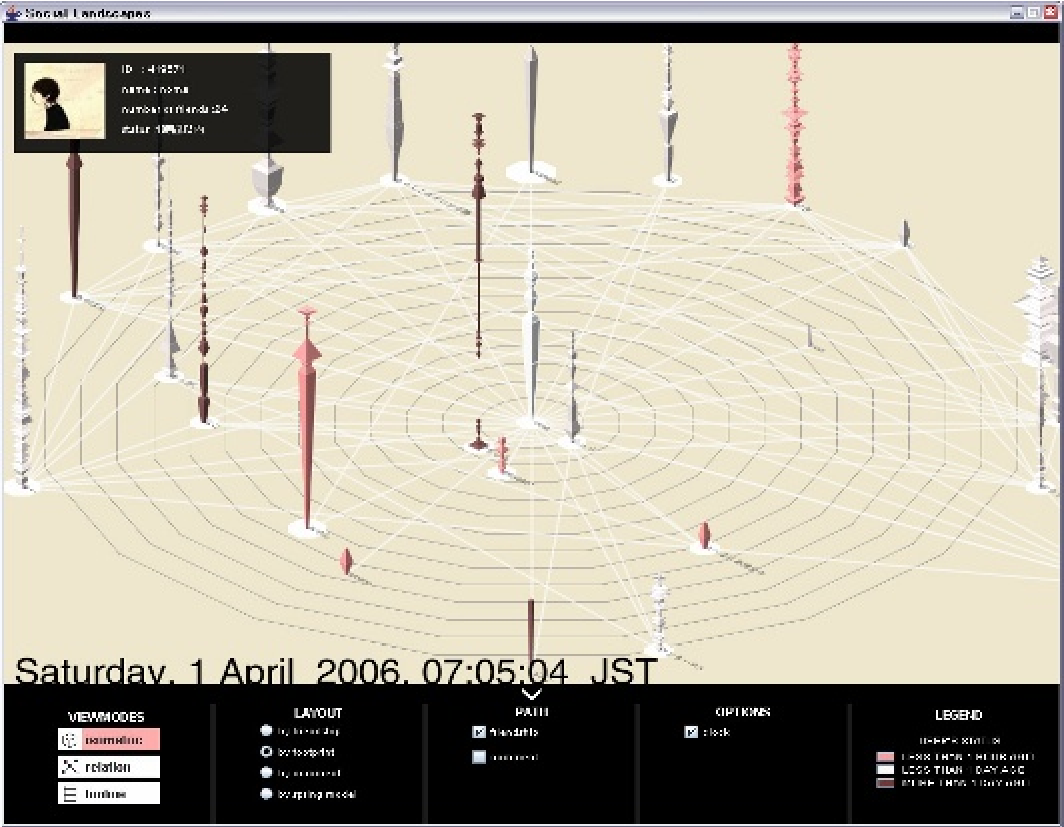 Figure 1: The Social Landscapes interface, showing multiple pillars representing different friends in a shared 3D space.
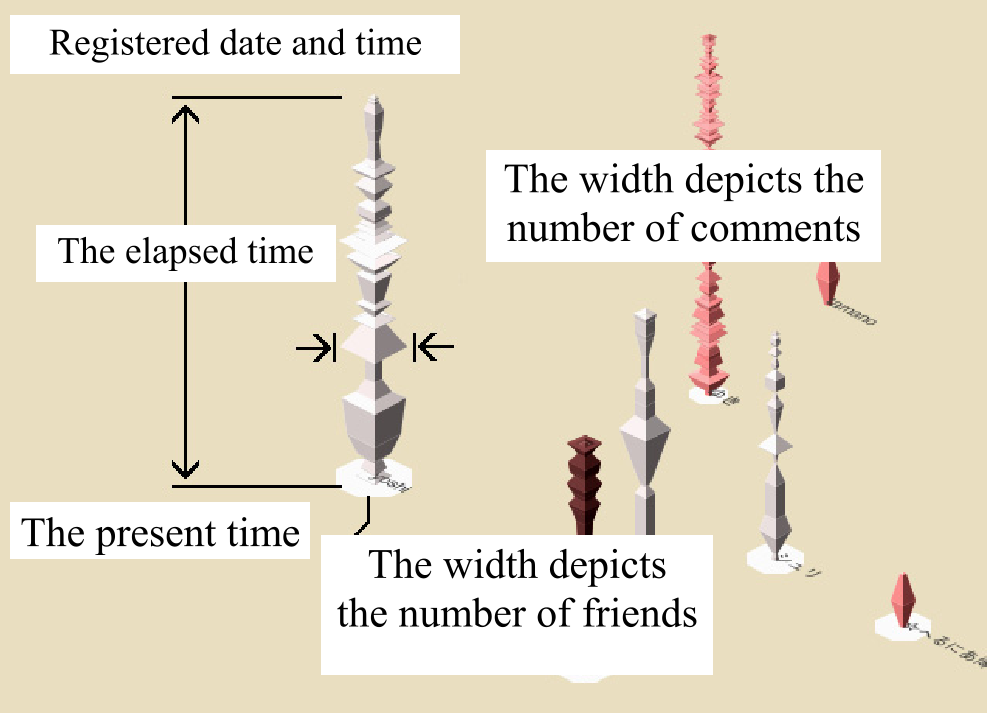 Figure 2: Detailed view of the Pillar Shaped Timeline (PST), mapping temporal data to vertical segments.
Why it Works: The Passive Awareness Advantage
Unlike a standard feed that requires active scrolling, a "landscape" allows for preattentive processing. A user can glance at the scene and immediately identify "islands" of high activity or "valleys" of inactivity.
The implementation using mixi data demonstrated that this spatial arrangement assists in memory retention. By seeing friends as literal "landmarks" in a 3D world, users are more likely to remember to reach out, thereby strengthening the actual human relationships behind the data.
Critical Insight & Future Outlook
While Social Landscapes debuted in an era of early SNS (like mixi), its core philosophy is more relevant today than ever. In the current age of "doomscrolling," we lack high-level visual summaries of our digital social health.
Strengths:
- Metaphorical Clarity: Using "growth" (pillars) and "light" (activity) makes data interpretation intuitive.
- Local Focus: By ignoring the total network structure and focusing on the user's immediate ego-network, it reduces cognitive overhead.
Limitations:
- Scalability: As the number of friends grows, the 3D landscape might become as cluttered as the graph networks it seeks to replace.
- Platform Silos: The current implementation is tied to specific data sources, making cross-platform awareness difficult.
Conclusion
Social Landscapes is a pioneering step toward Human-Centric Visualization. It reminds us that social data is not just a graph—it is a history of human interaction that deserves a more organic and reflective visual language.