
Twitter as a Social Sensor: Predicting Southern California Traffic with 3-Hour Lead Times
Analyzing social media communications for correlation with freeway vehicular traffic
This paper investigates the correlation between social media activity (Twitter) and vehicular traffic flow across major freeways in Southern California. By analyzing time-series data from Twitter and Caltrans PeMS sensors, the authors identify a predictive relationship where social media communication patterns lead vehicular traffic changes.
TL;DR
Can we predict a traffic jam on the I-405 before the first car even hits the brakes? Research from California State University suggests the answer lies in our tweets. By correlating Twitter message volume with freeway sensor data, researchers found that social media activity peaks approximately 3 hours before vehicle density increases, providing a critical window for proactive traffic management.
The Motivation: Moving Beyond "What Is" to "What Will Be"
Modern navigation apps like Waze and Google Maps are excellent at telling us that we are currently in traffic. This is because they rely on participatory physical sensing—GPS data from cars already on the road. However, true Short-term Traffic Forecasting remains a "holy grail" for urban planning.
The researchers hypothesized that since human activities (going to work, attending events, or preparing to travel) are preceded by communication, social media could serve as a "Social Sensor." The goal was to prove that digital chatter is not just correlated with traffic, but actually leads it.
Methodology: Mining Digital and Physical Pulses
To test this, the team focused on one of the world's most congested regions: Southern California.
- Digital Sensing (Twitter): Using the Twitter REST API, they harvested tweets filtered by keywords like "Los Angeles," "Orange County," and specific freeway numbers (e.g., "405").
- Physical Sensing (PeMS): They extracted vehicle flow data from Caltrans Performance Measurement System (PeMS), which utilizes thousands of inductive loop sensors embedded in the asphalt.
- Synchronization: Data was binned into 5-minute intervals and then aggregated to hourly averages to smooth out noise, allowing for a clear view of the "diurnal rhythm" of the city.
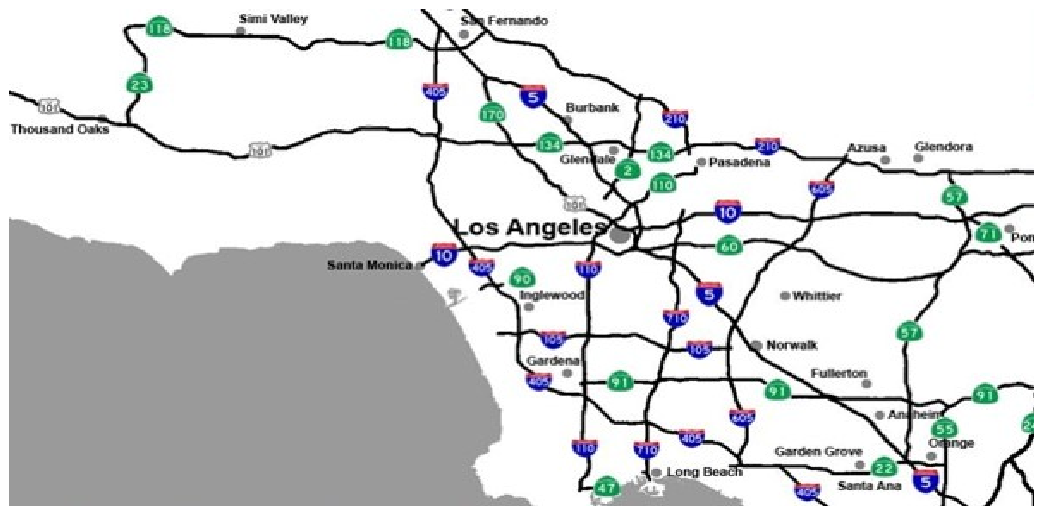 Fig 1: The map of Southern California freeways (I-5, I-10, CA-60, I-405) targeted in the study.
Key Findings: The 3-Hour Signal
The data revealed a striking synchronicity. Both social media volume and vehicular traffic followed a heavy periodic cycle. However, the correlation wasn't 1:1 in real-time.
By applying a Cross-Correlation analysis (shifting the time-series against one another), the authors found that the correlation coefficient (ranging from 0.3 to 0.4) peaked when the Twitter data was shifted by -3 hours.
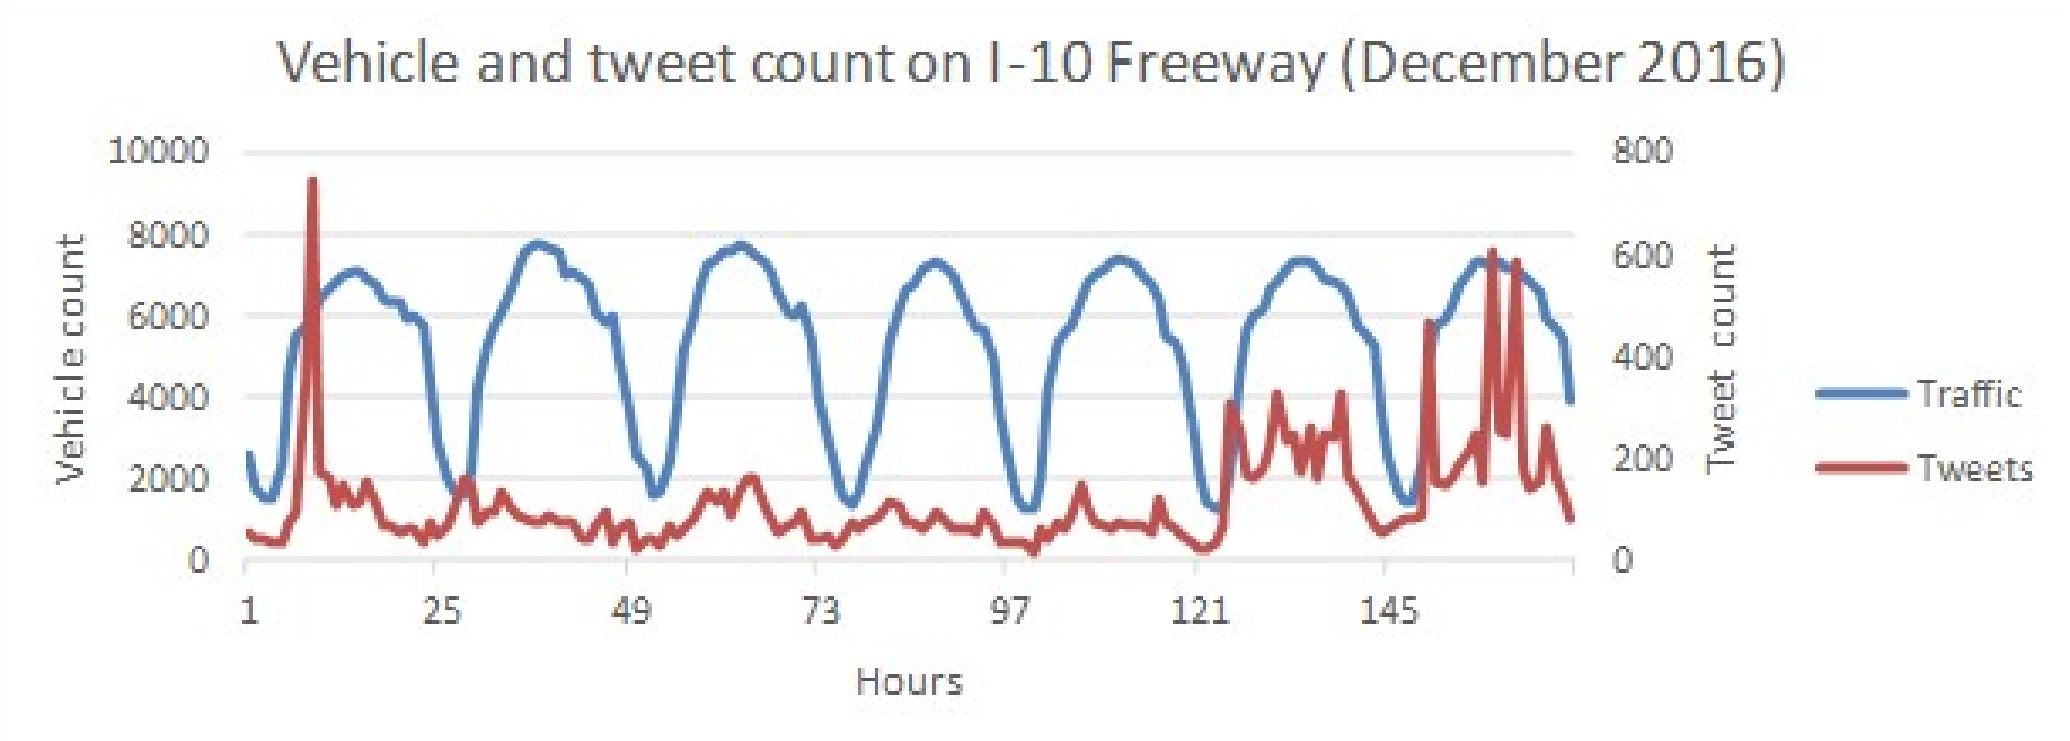 Fig 2: A comparison of tweet counts and vehicular traffic for the I-10 freeway. Note the similar periodic "waves" of activity.
Consistency Across Regions
One of the most robust findings was that this relationship held true regardless of the specific freeway or county. Whether it was the I-5 in Orange County or the I-10 in Los Angeles, the patterns were remarkably consistent, suggesting that social media captures a fundamental "pulse" of human activity that precedes road usage.
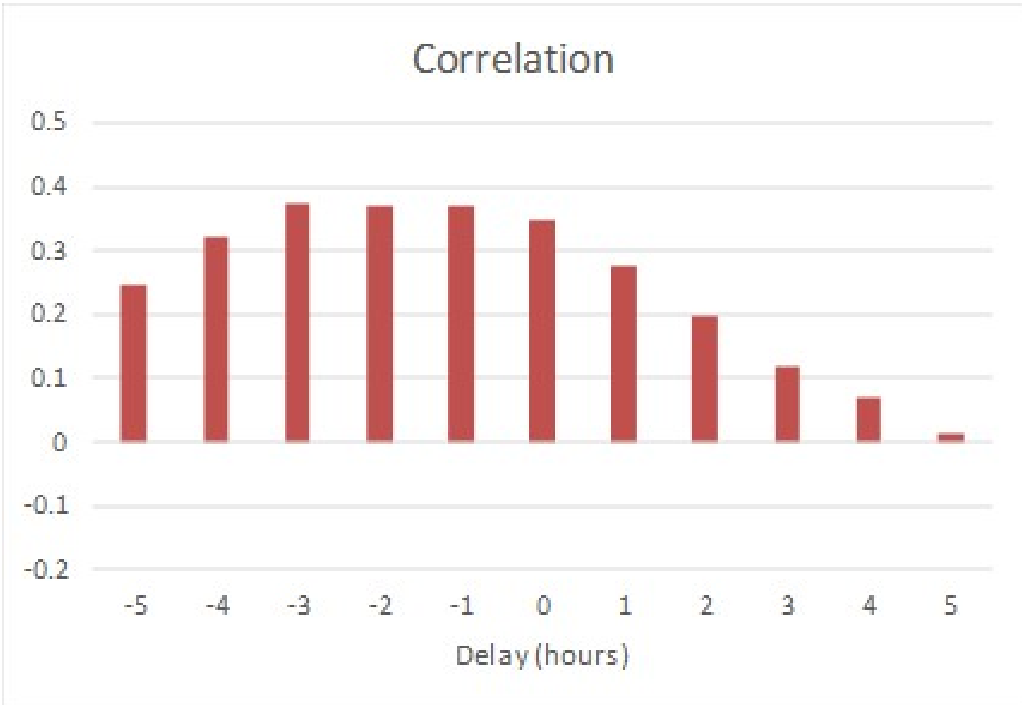 Fig 3: Results of the lag analysis for I-10. The peak correlation clearly occurs at the -3 hour mark.
Critical Analysis & Professional Insight
While the 0.3 to 0.4 correlation might seem modest compared to pure physical models, its value lies in its temporal precedence. In machine learning terms, this social media volume acts as a high-value feature for "early-warning" systems.
Limitations to Consider:
- Keyword Sensitivity: The results are highly dependent on the quality of the "keyword filter." If the lexicon doesn't evolve with slang or specific event names, the signal might weaken.
- The "Noise" of Life: Social media counts capture all human activity, not just travel intent. Future work using Sentiment Analysis or NLP could separate "I'm heading to the game" (predictive) from "I'm stuck in traffic" (reactive).
Conclusion
This research demonstrates that our digital footprint is a precursor to our physical footprint. For urban planners and AI researchers, this means that the next generation of traffic prediction models shouldn't just look at the road—they should look at the clouds (the digital ones). By leveraging this 3-hour lead time, city management could theoretically adjust ramp metering, public transit alerts, or toll pricing well before the congestion reaches critical mass.