
Reliability of Social Media Data: Why Your Choice of Collection Tool Might Break Your Social Network Analysis
A method to evaluate the reliability of social media data for social network analysis
This paper presents a systematic methodology to evaluate the reliability of Online Social Network (OSN) data for Social Network Analysis (SNA). By comparing parallel datasets collected from Twitter using different tools (Twarc and RAPID), the authors demonstrate how variations in collection mechanisms significantly impact both network structural metrics and node-level centrality rankings.
TL;DR
Is the social network you're analyzing a reflection of reality or just a byproduct of your data collection tool? This study reveals that parallel datasets collected from Twitter at the exact same time using different software (Twarc vs. RAPID) yield significantly different network topologies. While "big-picture" content like top hashtags remains stable, the fine-grained social structure—who is influential and how communities cluster—can vary wildly.
The Hidden Trap in "Big Data"
In the world of Social Network Analysis (SNA), we often treat data collected via APIs as a "gold standard" representation of human interaction. However, this paper exposes a critical vulnerability: Collection Bias. Between platform-imposed rate limits, proprietary filtering algorithms, and tool-specific keyword expansion, two researchers "watching" the same event might end up with two different versions of the truth.
Methodology: The Parallel Collection Experiment
The researchers monitored the Australian TV show #QandA, collecting data in two parts using two distinct tools:
- Twarc: An open-source baseline that wraps the Twitter API directly.
- RAPID: A sophisticated platform that uses "co-occurrence keyword expansion" to dynamically update its filter.
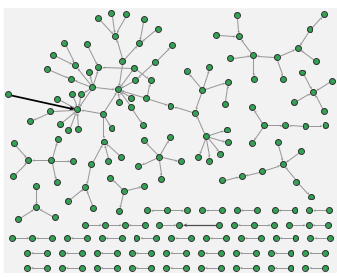
They then built three types of networks—Mentions, Replies, and Retweets—and compared them across four dimensions: Statistics, Topology, Centrality, and Clustering.
Key Insights: Where the Data Diverges
1. The Volume Gap
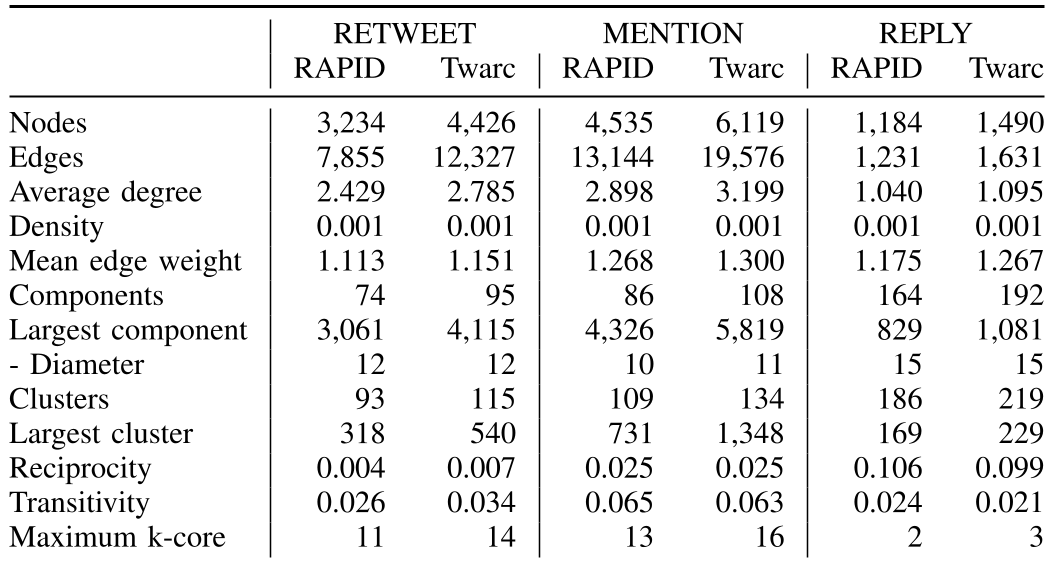
Surprisingly, the baseline tool (Twarc) consistently captured more tweets and unique accounts than the "advanced" RAPID platform in Part 1 of the experiment. Investigation revealed that tool-specific logic—such as how a program discards tweets where keywords only appear in metadata rather than the body—can result in thousands of lost nodes.
2. Centrality Instability
Crucially for those researching "Influencers," node rankings shifted dramatically.
- Global metrics (Betweenness and Eigenvector centrality) were relatively stable.
- Local metrics (Degree and Closeness centrality) were highly sensitive to missing data. If you use simple "degree" to find the most important person in a network, your results may be more a function of your software's performance than the user's actual influence.
3. Structural Resilience
There is a silver lining. The diameter of the largest component and the most mentioned accounts remained remarkably consistent. This suggests that while the "periphery" of a social network is noisy and prone to collection error, the "core" of the conversation is robust to sampling variations.
Conclusion and Best Practices
The paper serves as a vital warning for academic and industry researchers. To ensure your SNA results are reliable:
- Be Tool-Aware: Understand whether your tool filters data beyond what the API itself does.
- Monitor Integrity: Check for connection failures or dropped streams during high-traffic events.
- Validate Filters: Carefully construct filter conditions to avoid "over-collection" (noise) or "under-collection" (missing key actors).
As we move further into a world dominated by algorithmic data access, the reliability of our source material is no longer something we can take for granted.
Takeaway for Future Research
This research highlights the need for a standardized reporting protocol in OSN studies, where researchers must disclose not just the "what" of their data, but the technical "how" of its acquisition.