
Occupy Twitter: How Computational Metrics Predict the Pulse of Social Movements
Analyzing the impact of social media on social movements: a computational study on Twier and the occupy wall street movement
This paper presents a computational framework to quantify the impact of social media on grassroots activism, specifically analyzing the Occupy Wall Street (OWS) movement via Twitter data. By employing network analysis and PageRank-inspired metrics, the study establishes a direct correlation between digital discourse volume and real-world protest vitality.
TL;DR
Researchers from Washington State University and their collaborators have moved beyond the "anecdotal" phase of social media analysis. By studying over 430,000 tweets from the Occupy Wall Street (OWS) movement, this study demonstrates that digital "buzz" isn't just noise—it is a measurable, predictive indicator of offline protest vitality, geographic spread, and participant intent.
Background: Beyond the Arab Spring Anecdotes
For years, the "Arab Spring" served as the primary case study for social media's role in revolution. However, much of that narrative was built on news reports rather than hard data. This paper shifts the paradigm by treating Twitter as a dynamic system, applying methodologies originally designed for computer networks to sociology.
The core intuition? If we can measure the "vibrancy" of a network through volume, velocity, and influence, we can quantify the health of a social movement.
Methodology: The Digital Measurement Toolkit
The authors didn't just count tweets; they dismantled the anatomy of a digital movement through several lenses:
1. Movement Vitality & Forecasting
By correlating tweet volume with specific dates, the researchers found that Twitter activity often precedes physical action.
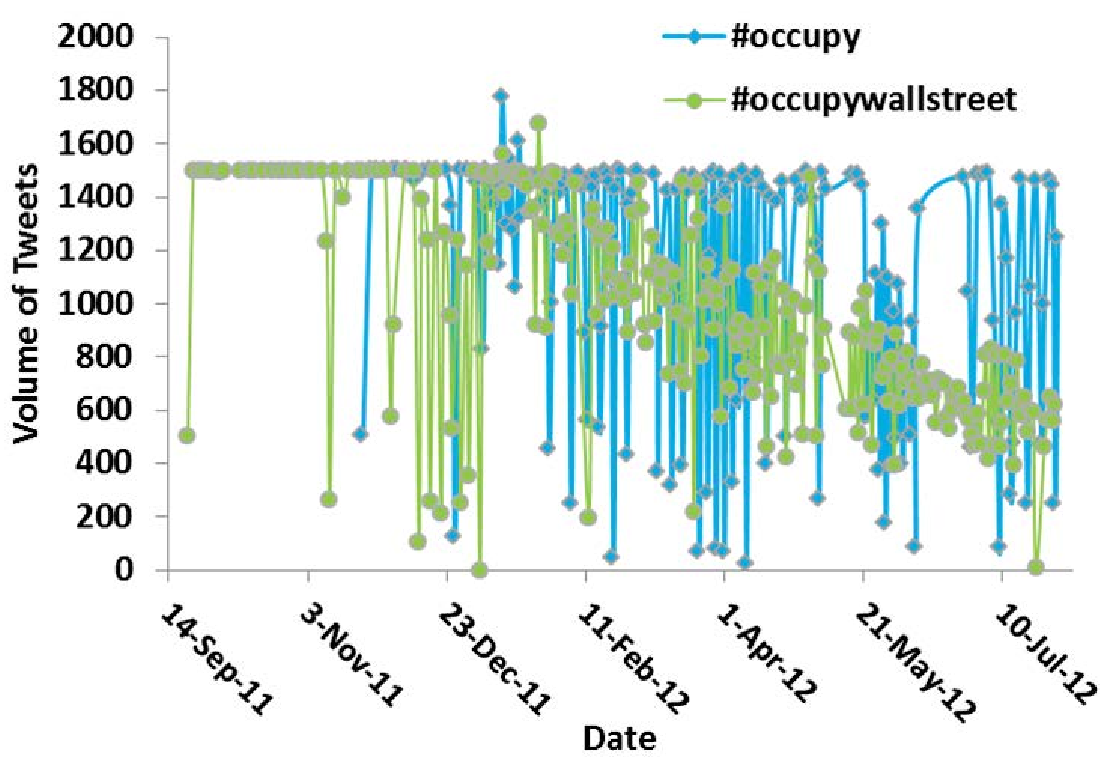 Figure 1: Comparison of #occupy and #occupywallstreet volumes, showing the lifecycle of the movement from mobilization to gradual decline.
A key discovery was the "spike" on December 16, 2011. This surge in digital traffic served as a precursor to the 3-month anniversary re-occupation events where 50 protesters were eventually arrested. This suggests that social media monitoring can act as a forecasting tool for civil unrest.
2. Identifying Buzz Makers and Influence
Using a strategy inspired by Google’s PageRank, the study defines influence not just by follower count, but by the "incitement" of retweets.
- Buzz Makers: High-volume producers who keep the conversation alive.
- Information Flow: Retweets account for roughly 30-40% of the movement's traffic, signaling "group thinking" and the rapid dissemination of tactical information.
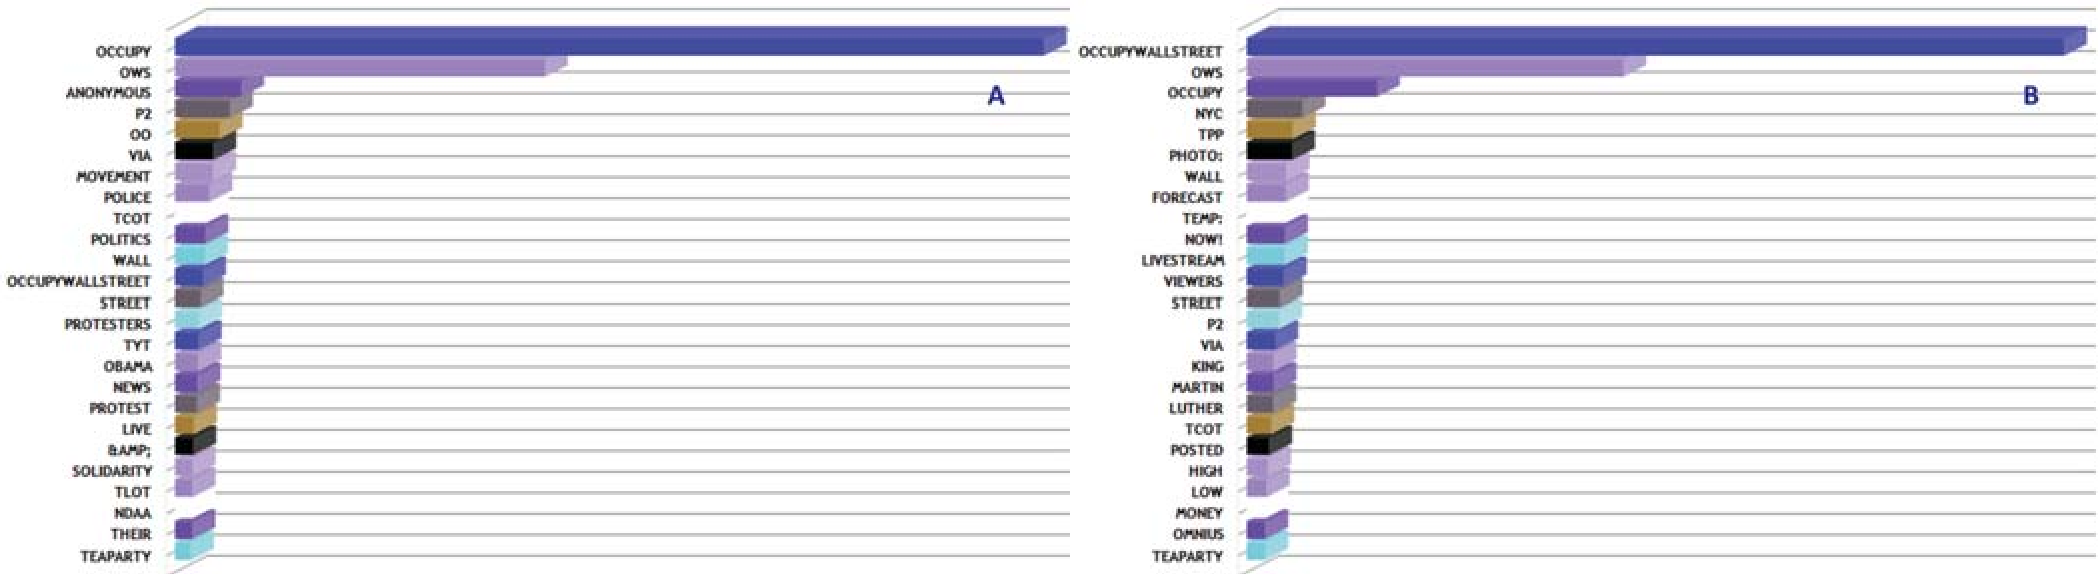 Figure 2: Keyword frequency analysis showing the difference between general news-sharing (#occupy) and tactical organizing (#occupywallstreet).
Experiments & Key Findings
The Content Gap: Info vs. Action
The study highlights a fascinating split in hashtag usage. Followers of #occupy tended to use terms like "news," "live," and "police," treating the hashtag as a real-time news wire. Conversely, #occupywallstreet users focused on "organizing" and "campaigns," reflecting a more tactical, action-oriented core.
The "Mobile" Generation
By analyzing the source of the tweets (the "User-Agent"), the researchers found that only about 31-35% of traffic came from the traditional Twitter browser interface. The heavy use of iPhone, Android, and TweetDeck suggests that OWS was powered by a younger, technology-inclined demographic capable of tweeting "on the move" during actual protests.
| Rank | #Occupy (Source) | #OccupyWallStreet (Source) |
|---|---|---|
| 1 | Web (35%) | Web (31%) |
| 2 | Tweet Deck (10%) | Social Oomph (8%) |
| 4 | Twitter for iPhone (7%) | Tweet Button (5%) |
Note: Data indicates a high reliance on mobile and specialized management tools, suggesting a professionalized or highly tech-native base.
Critical Insight: The "Digital Nervous System"
The most profound takeaway is the concept of Geographic Diffusion. While OWS started in Zuccotti Park, the "digital footprint" showed participants spread across the globe. However, the study confirms that despite the "borderless" nature of the internet, digital intensity remains highest near the physical locations of ground events—confirming that social media augments, rather than replaces, physical presence.
Conclusion & Future Work
This paper serves as a foundational step toward a fully automated "Social Movement Dashboard." While the study had limitations (API rate limits restricted data to 1,500 tweets/day), it proves that social media analysis can provide an objective, real-time measure of societal grievances and mobilization strength.
The next frontier? Emotional Landscape analysis. The authors are already moving toward integrating the Affective Norms for English Words (ANEW) to measure the shift from hope to anger in real-time.
Author Analysis: This work is a classic example of "Computational Sociology." By applying graph theory and time-series analysis to political science, it bridges the gap between the chaotic reality of street protests and the structured data of the digital world.