
Identifying the Shadow: A Multi-Metric Approach to Criminal Group Discovery
Social Network Analysis in Multiple Social Networks Data for Criminal Group Discovery
This paper introduces a Comprehensive Indicator Model for Criminal Network Analysis (CNA) leveraging Social Network Analysis (SNA) metrics. By integrating Degree, Betweenness, and Closeness centralities into a single weighted score, the approach systematically identifies criminal leaders and conspirators within complex communication datasets.
TL;DR
Criminal networks operate on a paradox: they must be efficient enough to coordinate crimes but secret enough to avoid detection. This paper proposes an automated system using Social Network Analysis (SNA) to rank suspects by their structural importance. By synthesizing connectivity, brokerage, and proximity into a "Comprehensive Indicator," the authors demonstrate a high-precision method for identifying ringleaders within large-scale communication logs.
Problem & Motivation: The Manual Burden of Investigation
In modern criminal investigations—such as white-collar crime or conspiracy—investigators are often overwhelmed by "Message Traffic." Sifting through thousands of emails or messages to find a handful of conspirators hidden among innocent employees is a needle-in-a-haystack problem.
The author points out that current Criminal Network Analysis (CNA) is largely manual. Without quantitative tools, investigators risk:
- False Accusations: Indicting people like "Carol" whose social links look suspicious but are functionally irrelevant.
- Missing Key Subjects: Failing to indict "Inez," a clandestine participant who hides behind others.
- Inefficient Resource Allocation: Spending months on low-level actors while leaders remain free.
Methodology: The Comprehensive Indicator Model
The core of the paper is moving beyond single-metric analysis. A leader might have many links (Degree), but a "gatekeeper" who controls information flow might have high Betweenness. The authors propose a unified score :
- Relative Degree (): Highlights "stars" or leaders with high direct communication.
- Relative Betweenness (): Identifies "bridges" who connect different parts of the conspiracy.
- Relative Closeness (): Measures how easily a node can reach others; lower values (smaller distances) indicate a more central, influential position (hence the negative sign in the composite score).
The Extraction Process
Before calculating metrics, the network is "cleaned" via three steps:
- Topic Filtering: Keeping only messages related to suspicious keywords (e.g., "The Budget" or "Unknown Issues").
- Edge Enhancement: Connecting known conspirators to their direct contacts to expose potential accomplices.
- Purging: Removing known non-conspirators to reduce noise.
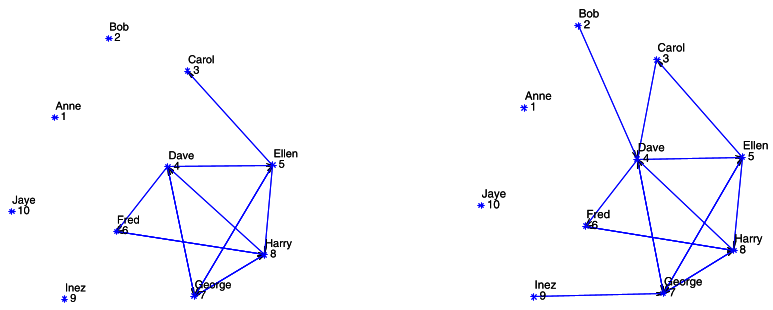 Figure 1: Transition from raw communication links to a filtered criminal network graph.
Experiments: Validating the Model
The authors tested the model on the "EZ Case" and an expanded 83-node dataset.
The EZ Case Results
In a small-group scenario, the model generated a priority list that placed known conspirators Dave and George at the top. Critically, it correctly identified Carol as the lowest priority among the "suspect" group, matching later findings that the charges against her were dropped.
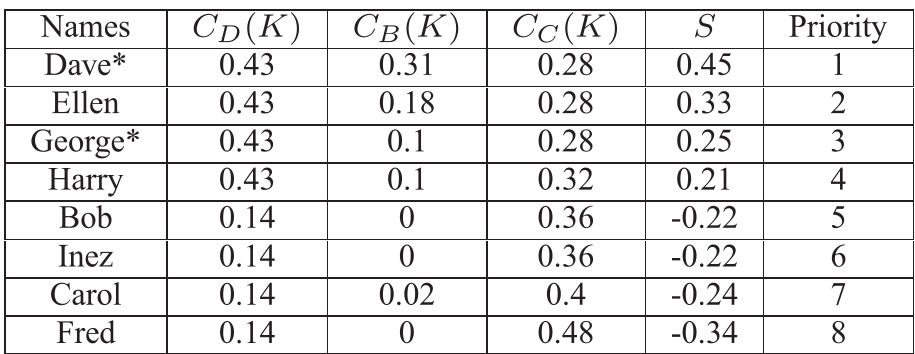 Table 1: The ranking of suspects in the EZ Case. Higher S-scores correlate perfectly with criminal involvement.
Scaling to 83 Nodes
When applied to a larger dataset with 400 links and 21,000 words of text, the model remained robust:
- Conspirator Identification: 6 out of 7 known conspirators appeared at the very top of the priority list.
- False Positive Control: Non-conspirators consistently ranked in the lower tiers of the "Comprehensive Indicator."
Critical Insight: Why This Works
The brilliance of this model lies in the synergy of centralities. A criminal "boss" might not talk to everyone (low Degree) to maintain secrecy, but they often act as a critical bridge for commands (high Betweenness). By combining these metrics, the model captures different "masks" a criminal might wear.
Conclusion & Future Outlook
This work demonstrates that SNA is not just a sociological theory but a potent forensic tool. However, the model currently relies on manual Topic Selection to filter the network.
Future Directions:
- NLP Integration: Automatically identifying "suspicious topics" using Sentiment Analysis or Topic Modeling (LDA).
- Dynamic Analysis: Tracking how network centrality changes over time to predict when a crime is about to occur.
- Detection Avoidance: Researching how criminal networks evolve to specifically defeat SNA metrics (e.g., intentionally increasing network distance).
By quantifying the "hidden knowledge" of social structures, investigators can move from reactive searching to proactive, data-driven discovery.