
SmallBlue: Quantifying the ROI of Human Connection in the Enterprise
Social Network Analysis in Enterprise This paper focuses on the challenges and solutions in mining and analyzing social networks in enterprises; the authors base their study on a social network analysis tool called SmallBlue.
The paper presents SmallBlue (now IBM Atlas), a pioneering Social Network Analysis (SNA) system designed for large-scale enterprise environments. It introduces a comprehensive framework for mining multi-modal interaction data (email, IM, calendar) from over 400,000 employees globally to quantify the economic value of social capital and optimize organizational collaboration.
TL;DR
IBM researchers developed SmallBlue, a massive-scale social network analysis (SNA) platform that mines digital footprints—emails, IMs, and calendars—to map the "true" social fabric of an organization. Moving beyond academic theory, this work proves that network structure directly impacts the bottom line: consultants with diverse networks generate nearly $900 more in monthly revenue than their peers.
Context: Why "Friending" Isn't Enough
In the consumer world, social networks are about "likes" and "follows." In the enterprise, the stakes are different. The authors argue that traditional SNA was held back by static, manual surveys. SmallBlue shifts the paradigm by treating digital interactions as Social Sensors. It bridges the gap between sociology and big data, addressing the "Actual" social networks that drive productivity, rather than just formal organizational charts.
The "Structural Hole" Advantage
The core research intuition rests on the concept of Structural Holes. If all your friends know each other, your network is redundant. However, if you act as a bridge between two groups that don't otherwise communicate, you occupy a "Structural Hole."
Why does this matter?
People in these positions have:
- Information Advantage: Access to diverse, non-redundant ideas.
- Control Advantage: The ability to broker interactions between different departments.
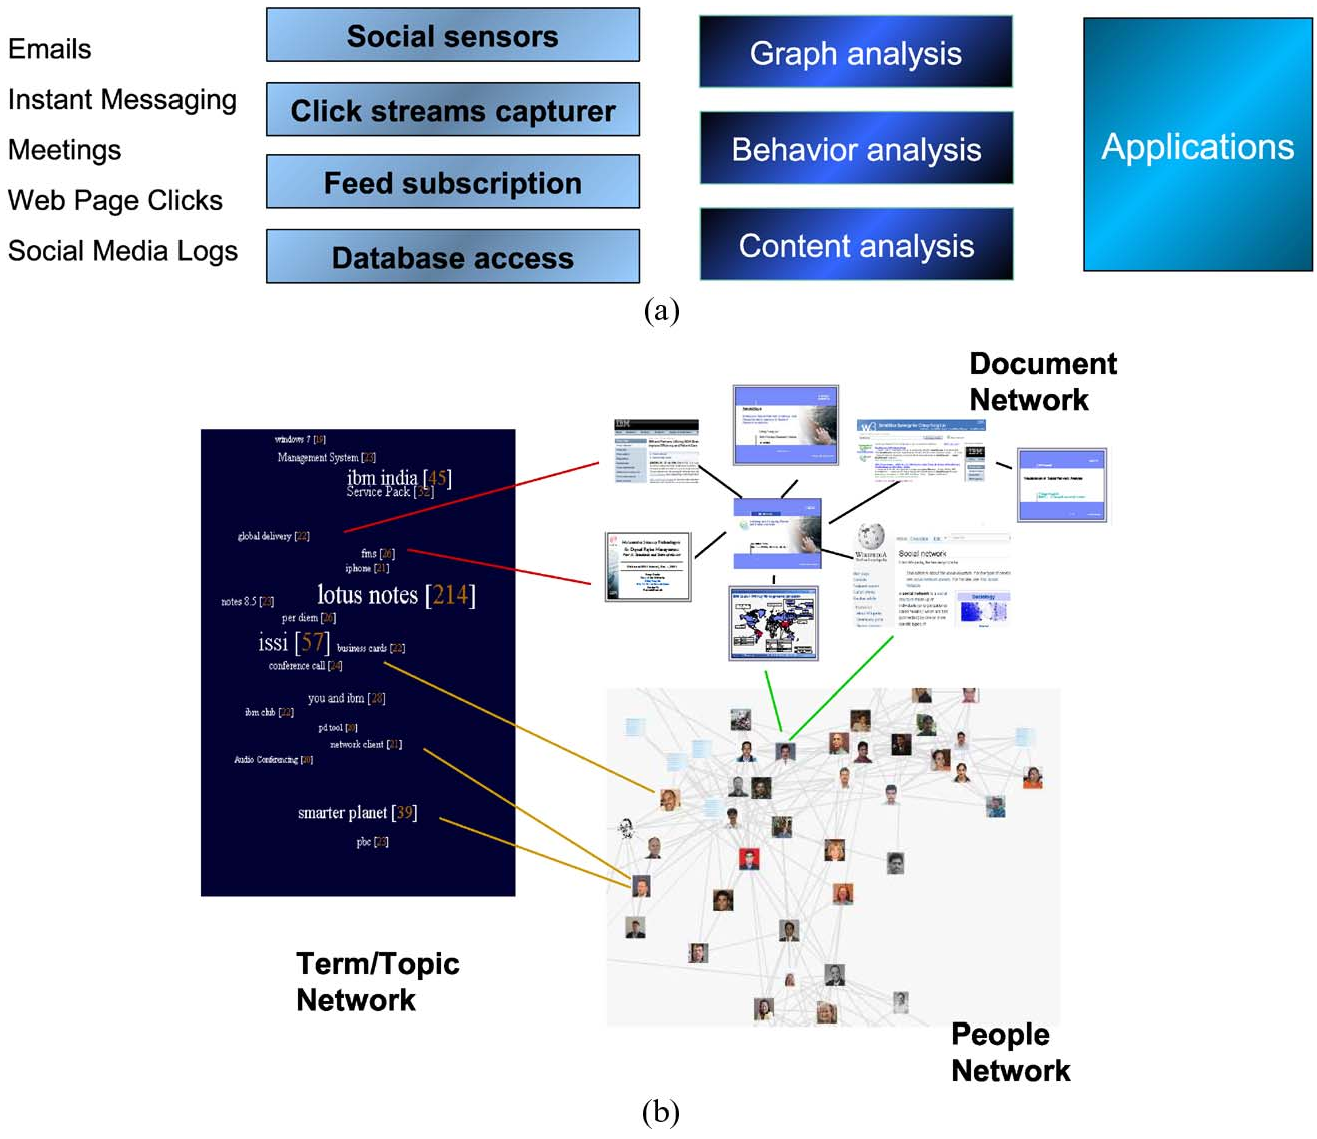 Figure: The SmallBlue system architecture, showing the pipeline from local social sensors to tripartite graph mining.
Methodology: Privacy by Design
One of the paper's most significant contributions is its solution to the Privacy/Analytics paradox. To comply with strict EU privacy laws, SmallBlue utilizes:
- Distributed Analysis: Processing copies of data on the user's local machine rather than intercepting communication on the server.
- Implicit Consent: No data is crawled without explicit user opt-in.
- Semantic Hash: Content is reduced to term-frequency statistics (one-grams/bi-grams), detaching personally identifiable information from the analysis.
Experimental Insights: The Cost of Too Many Cooks
The researchers matched the social graphs of 2,000+ consultants with their actual billable revenue. The findings are a masterclass in "Quantitative Sociology":
- Revenue Boost: One standard deviation increase in "Structural Hole" diversity correlates with $882.40 of additional monthly revenue.
- Adoption Payoff: Simply adopting the SmallBlue tool (helping people find experts) led to a gradual increase of $584 in monthly revenue after the first few months.
- The Manager Trap: While having a manager helps a project, having too many yields an "Inverse-U" curve. There is a sweet spot; beyond that, "too many cooks spoil the broth," and revenue actually drops due to coordination overhead and leadership conflict.
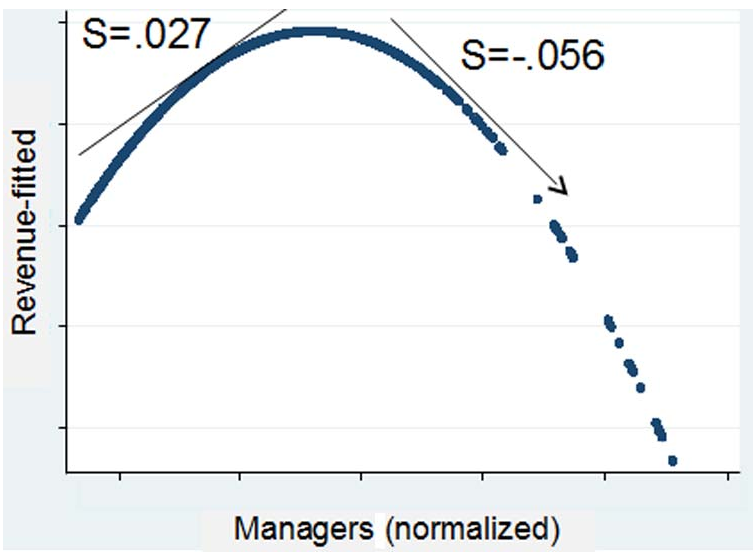 Figure: The "Inverse-U" relationship between the number of managers in a project and the billable revenue generated.
Global Scale Visualization: The HiMap Technique
Visualizing a network of 400,000 nodes is a nightmare. The authors introduced HiMap, an adaptive visualization tool that uses hierarchical clustering. Instead of a "hairball" graph, it provides:
- Overview First: High-level cluster views.
- Semantic Zooming: As you zoom in, the graph adaptively reloads to show individual nodes and "People Icons" only when relevant, preserving the user’s "visual momentum."
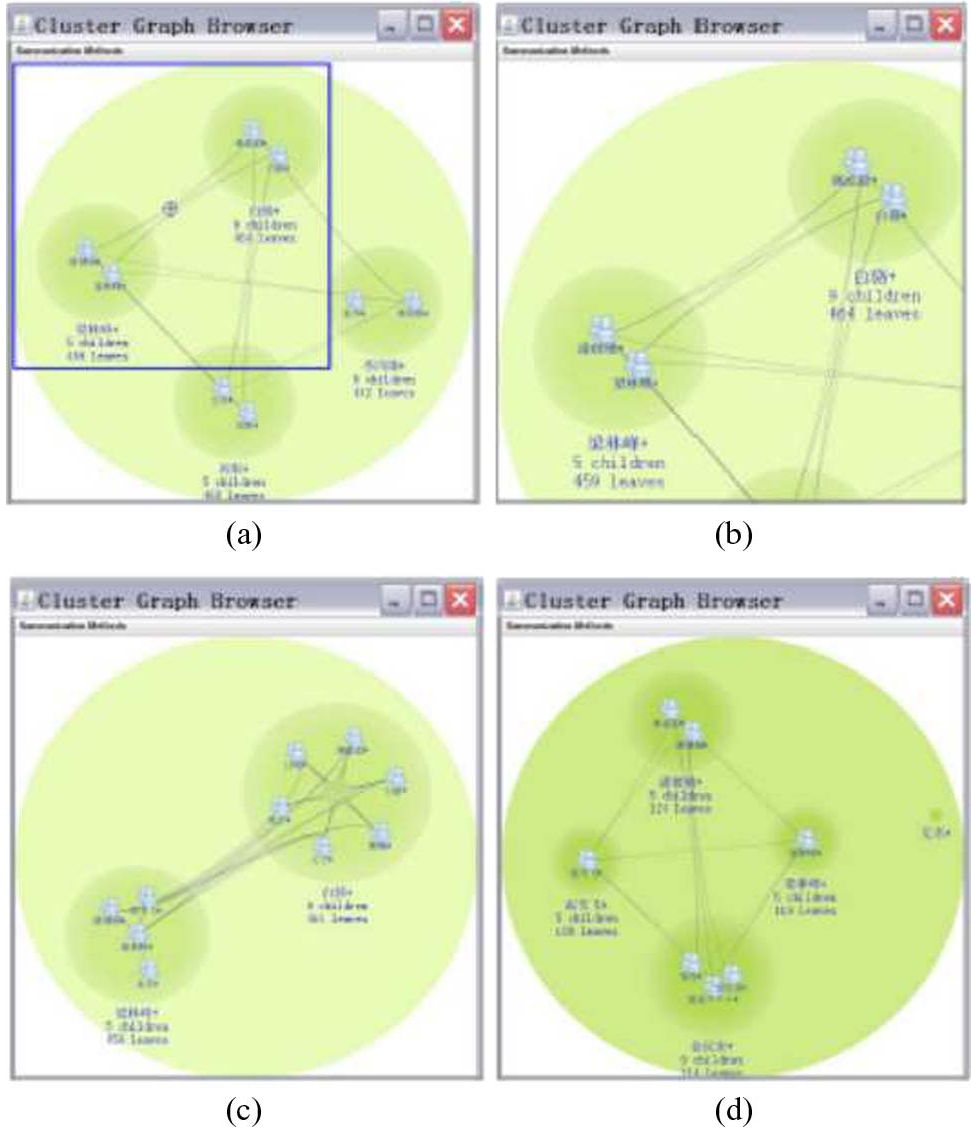 Figure: The HiMap interface traversing from a global cluster view to specific individual connections.
Critical Perspective & Summary
This paper is a seminal effort in Computational Social Science. It moves away from "what can we build?" to "what is it worth?"
Takeaways for the Industry:
- Social Capital is Measurable: It is no longer a soft metric; it can be tied to ERP and financial data.
- Culture Matters: The analysis also revealed cultural nuances (e.g., US employees use more positive sentiment; German employees are more willing to express negative sentiment in professional IMs), which are crucial for global management.
- Scalability is Solved via Graphs: Using Hadoop-based GBase allows the system to handle billions of edges, making real-time expertise search possible in massive conglomerates.
Limitations: The study primarily focuses on consultants. As the authors admit, Sales and R&D roles might prize "strong, long-term ties" (Trust) over "structural diversity" (Information breadth). Future work must reconcile these different "Network ROI" profiles.