
Mapping the Seeds of Power: Social Network Analysis in Brazilian Grain Production
Social Network Analysis on Grain Production in the Brazilian Scenario
This study applies Social Network Analysis (SNA) using Ucinet and Netdraw to evaluate the 2012/2013 Brazilian grain harvest (Soybean, Corn, Rice, Wheat). It identifies the Midwest and South as the dominant central nodes in terms of production volume and planted area, while the South leads in productivity (yield per hectare).
TL;DR
This research moves beyond simple spreadsheets to analyze Brazilian agriculture as a complex, interconnected network. By applying Social Network Analysis (SNA), researchers identified that while the Midwest is the powerhouse of scale (especially for Soybeans), the South represents a critical hub for productivity and resource efficiency. The study provides a roadmap for "peripheral" regions to adopt techniques from central agricultural "actors."
The Missing Link: Why Traditional Statistics Aren't Enough
Brazil is a global titan in agribusiness, but agricultural planning often relies on isolated data points—total tons produced vs. hectares planted. The authors argue that this overlooks the structural relationships between regions.
- The Problem: How do you determine which region or grain "influences" the national market the most?
- The Insight: By treating regions and grains as "Nodes" and their yields as "Ties," we can use Degree Centrality to find the true movers and shakers of the 2012/2013 harvest.
Methodology: High-Tech Tools for High-Yield Crops
The researchers utilized Ucinet® and Netdraw® to process data from CONAB (National Supply Company).
Key Metrics:
- InDegree: Represents the total volume/area associated with a specific grain across all regions.
- OutDegree: Measures the contribution of a specific region to the entire network of grains.
- Density: The internal strength of links, indicating how specialized or diverse a region's output is.
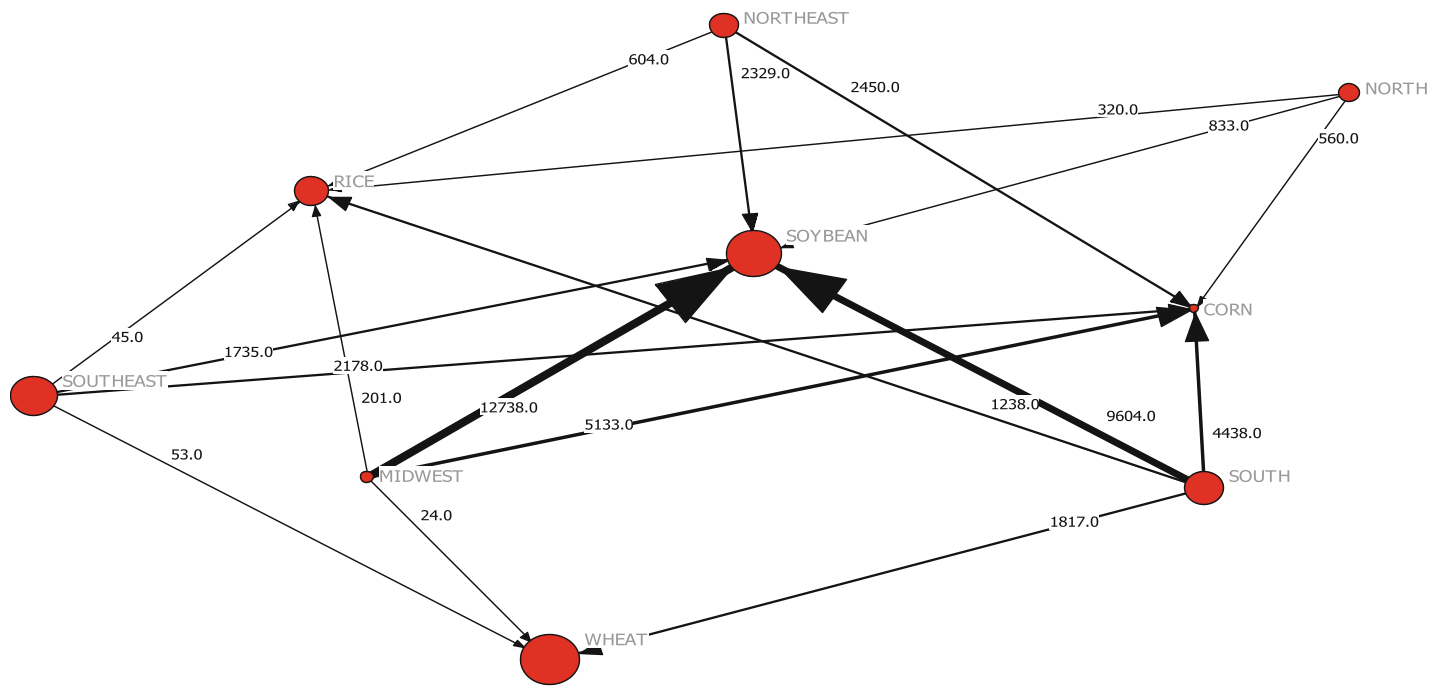 Figure 1: Network graph of Planted Area, where node size indicates centrality (influence) in the Brazilian landscape.
Core Findings: Scale vs. Efficiency
1. Planted Area & Total Production: The Midwest Reign
The Midwest emerged as the primary actor with an OutDegree of 18,096 million hectares and 68,077k tons in production. This dominance is largely driven by Soybean cultivation. The network visualization makes it clear: the Midwest is an "input hub" for international trade, particularly for China and the US.
2. Productivity: The South’s Technical Edge
Interestingly, when switching the lens to Productivity (kg/ha), the Southern region takes the lead (18,259 kg/ha).
- Rice & Corn: The South shows the highest productivity in these grains, benefiting from specialized machinery and soil correction techniques.
- Lesson: High production (Midwest) is a function of land volume; high productivity (South) is a function of technology and resource optimization.
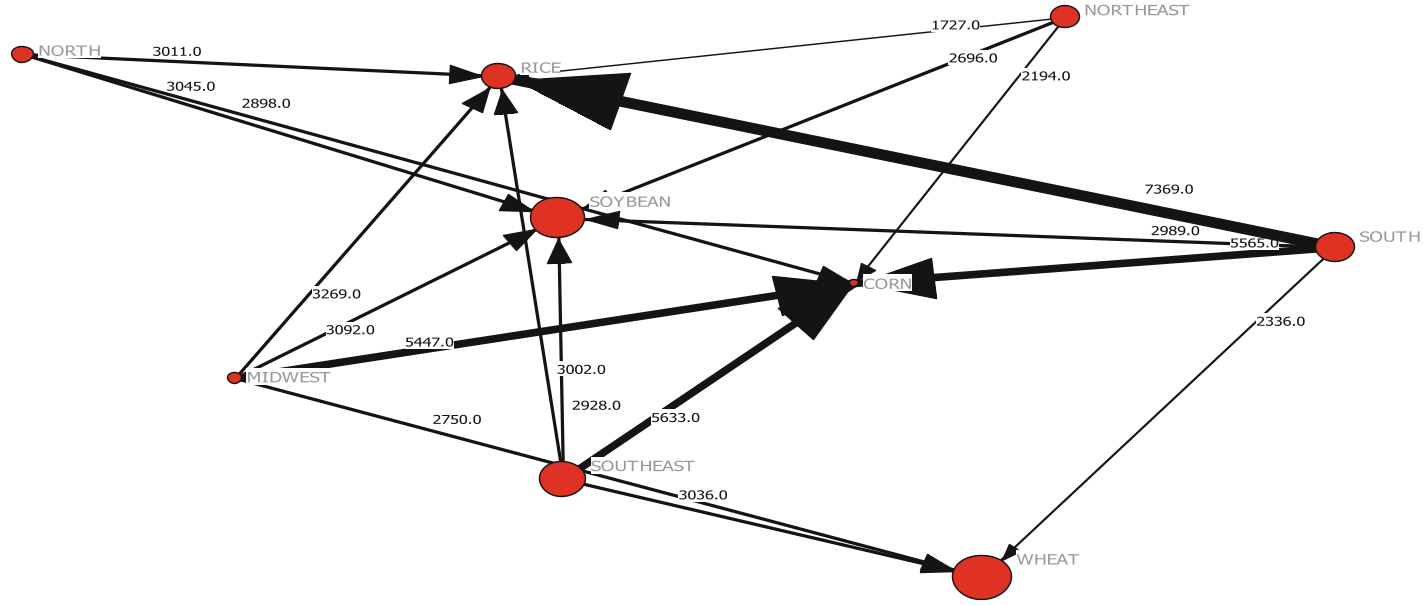 Figure 2: The Productivity Network highlights the South (largest node) as the leader in efficiency despite having less planted area than the Midwest.
Critical Analysis & Deep Insights
The true value of this study lies in its Heterogeneity Analysis. The data shows that the "power" in the network is distributed unevenly.
- North & Northeast (The Periphery): These regions have low centrality. The authors suggest that by identifying their distance from central nodes, producers can target these areas for "incremental changes" in rice and soybean planting to boost national yield.
- Strategic Planning: For a producer, high centrality in "Soy" indicates a stable, high-investment market, while peripheral nodes indicate untapped land potential but higher logistical risks.
Limitations
The study is based on the 2012/2013 harvest. Given the rapid advancement of AgTech and climate shifts in the last decade, a longitudinal study comparing this data to 2024/2025 would reveal the "migration" of centrality across the Brazilian map.
Conclusion: A Networked Future
This research proves that Social Network Analysis is not just for social media or corporate structures—it is a vital tool for macro-level agricultural planning. By understanding which regions are "central," policy makers can better allocate research funding, infrastructure, and tax breaks to bridge the gap between scale and efficiency.
Takeaway for the Industry: To increase national output, we shouldn't just plant more in the West; we should "Southernize" the productivity techniques of the North and Northeast.