
Beyond Centrality: Quantifying Social Influence via Multi-State Reliability
Social network analysis via multi-state reliability and conditional influence models
This paper introduces a Multi-State Reliability (MSR) framework to assess social networks, treating "influence" as a multi-state stochastic commodity. By modeling actors as multi-state components, the authors propose a Multi-state Two-Terminal Reliability (M2TRd) metric to calculate the probability that a specific influence level reaches a target node.
TL;DR
Social networks are usually analyzed through their structure—who knows whom. This paper shifts the paradigm by treating social networks as stochastic service networks. By applying Multi-State Reliability (MSR) theory, the authors quantify the probability that a specific "magnitude" of influence will reach a target, providing a far more nuanced view than traditional binary connectivity.
Problem & Motivation: The Limits of Centrality
Traditional Social Network Analysis (SNA) uses metrics like betweenness or closeness centrality to find powerful actors. However, in the real world, influence isn't just about being "in the middle"; it's about the strength and reliability of the message being passed.
The authors argue that:
- Influence is Multi-state: It’s not just "influential" or "not"—it has levels (e.g., 0 to 3).
- Influence is Stochastic: Passing a message involves a probability of degradation.
- Structure isn't Destiny: A direct path might be weaker than a longer, more "reliable" path.
Methodology: How Influence "Flows"
The core innovation lies in treating each actor as a multi-state component in a system. When an actor receives influences from their neighbors, they use a Communication Function to decide what to pass on.
The authors propose three cognitive models for actors:
- The Optimist (Maximum): . The actor passes on the strongest signal they receive.
- The Pessimist (Minimum): . The actor only moves as fast as their weakest link.
- The Analyst (Median): . The actor looks for the "middle ground" of consensus.
The Model Architecture
The reliability of the network is defined as the probability that the influence level at the target node meets or exceeds a required demand .
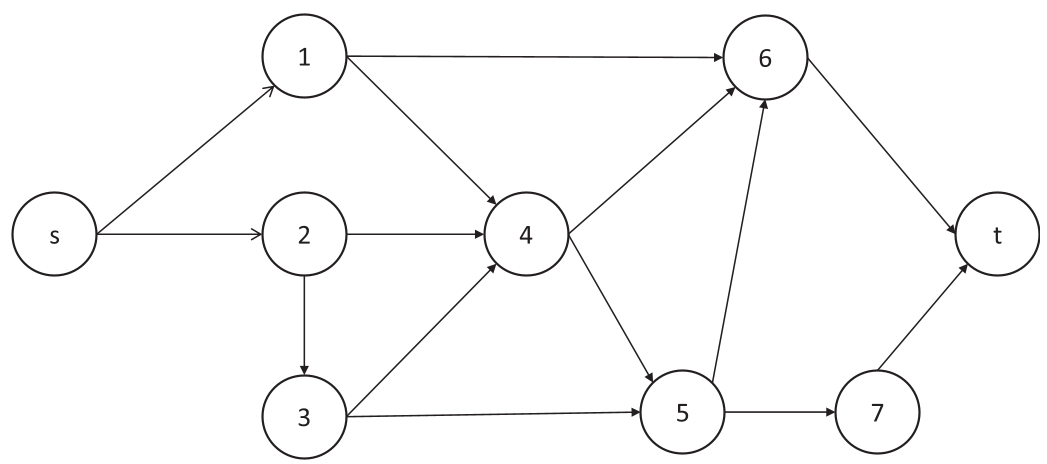 Figure 1: A notional social network showing directed influence flow from source to target.
Simulation and Scale
While small networks can be solved via Exhaustive Enumeration (EE), real networks (like the 310-node model used in the paper) require Monte Carlo (MC) Simulation. The authors used a topological sorting approach to ensure that the stochastic influence of a node's predecessors is calculated before its own output is sampled.
Experimental Insights: The S-Curve of Influence
The researchers found that network reliability doesn't decline linearly. Instead, it follows a distinct S-shape. There is a "tipping point" (threshold) where reliability collapses if the required influence demand is too high.
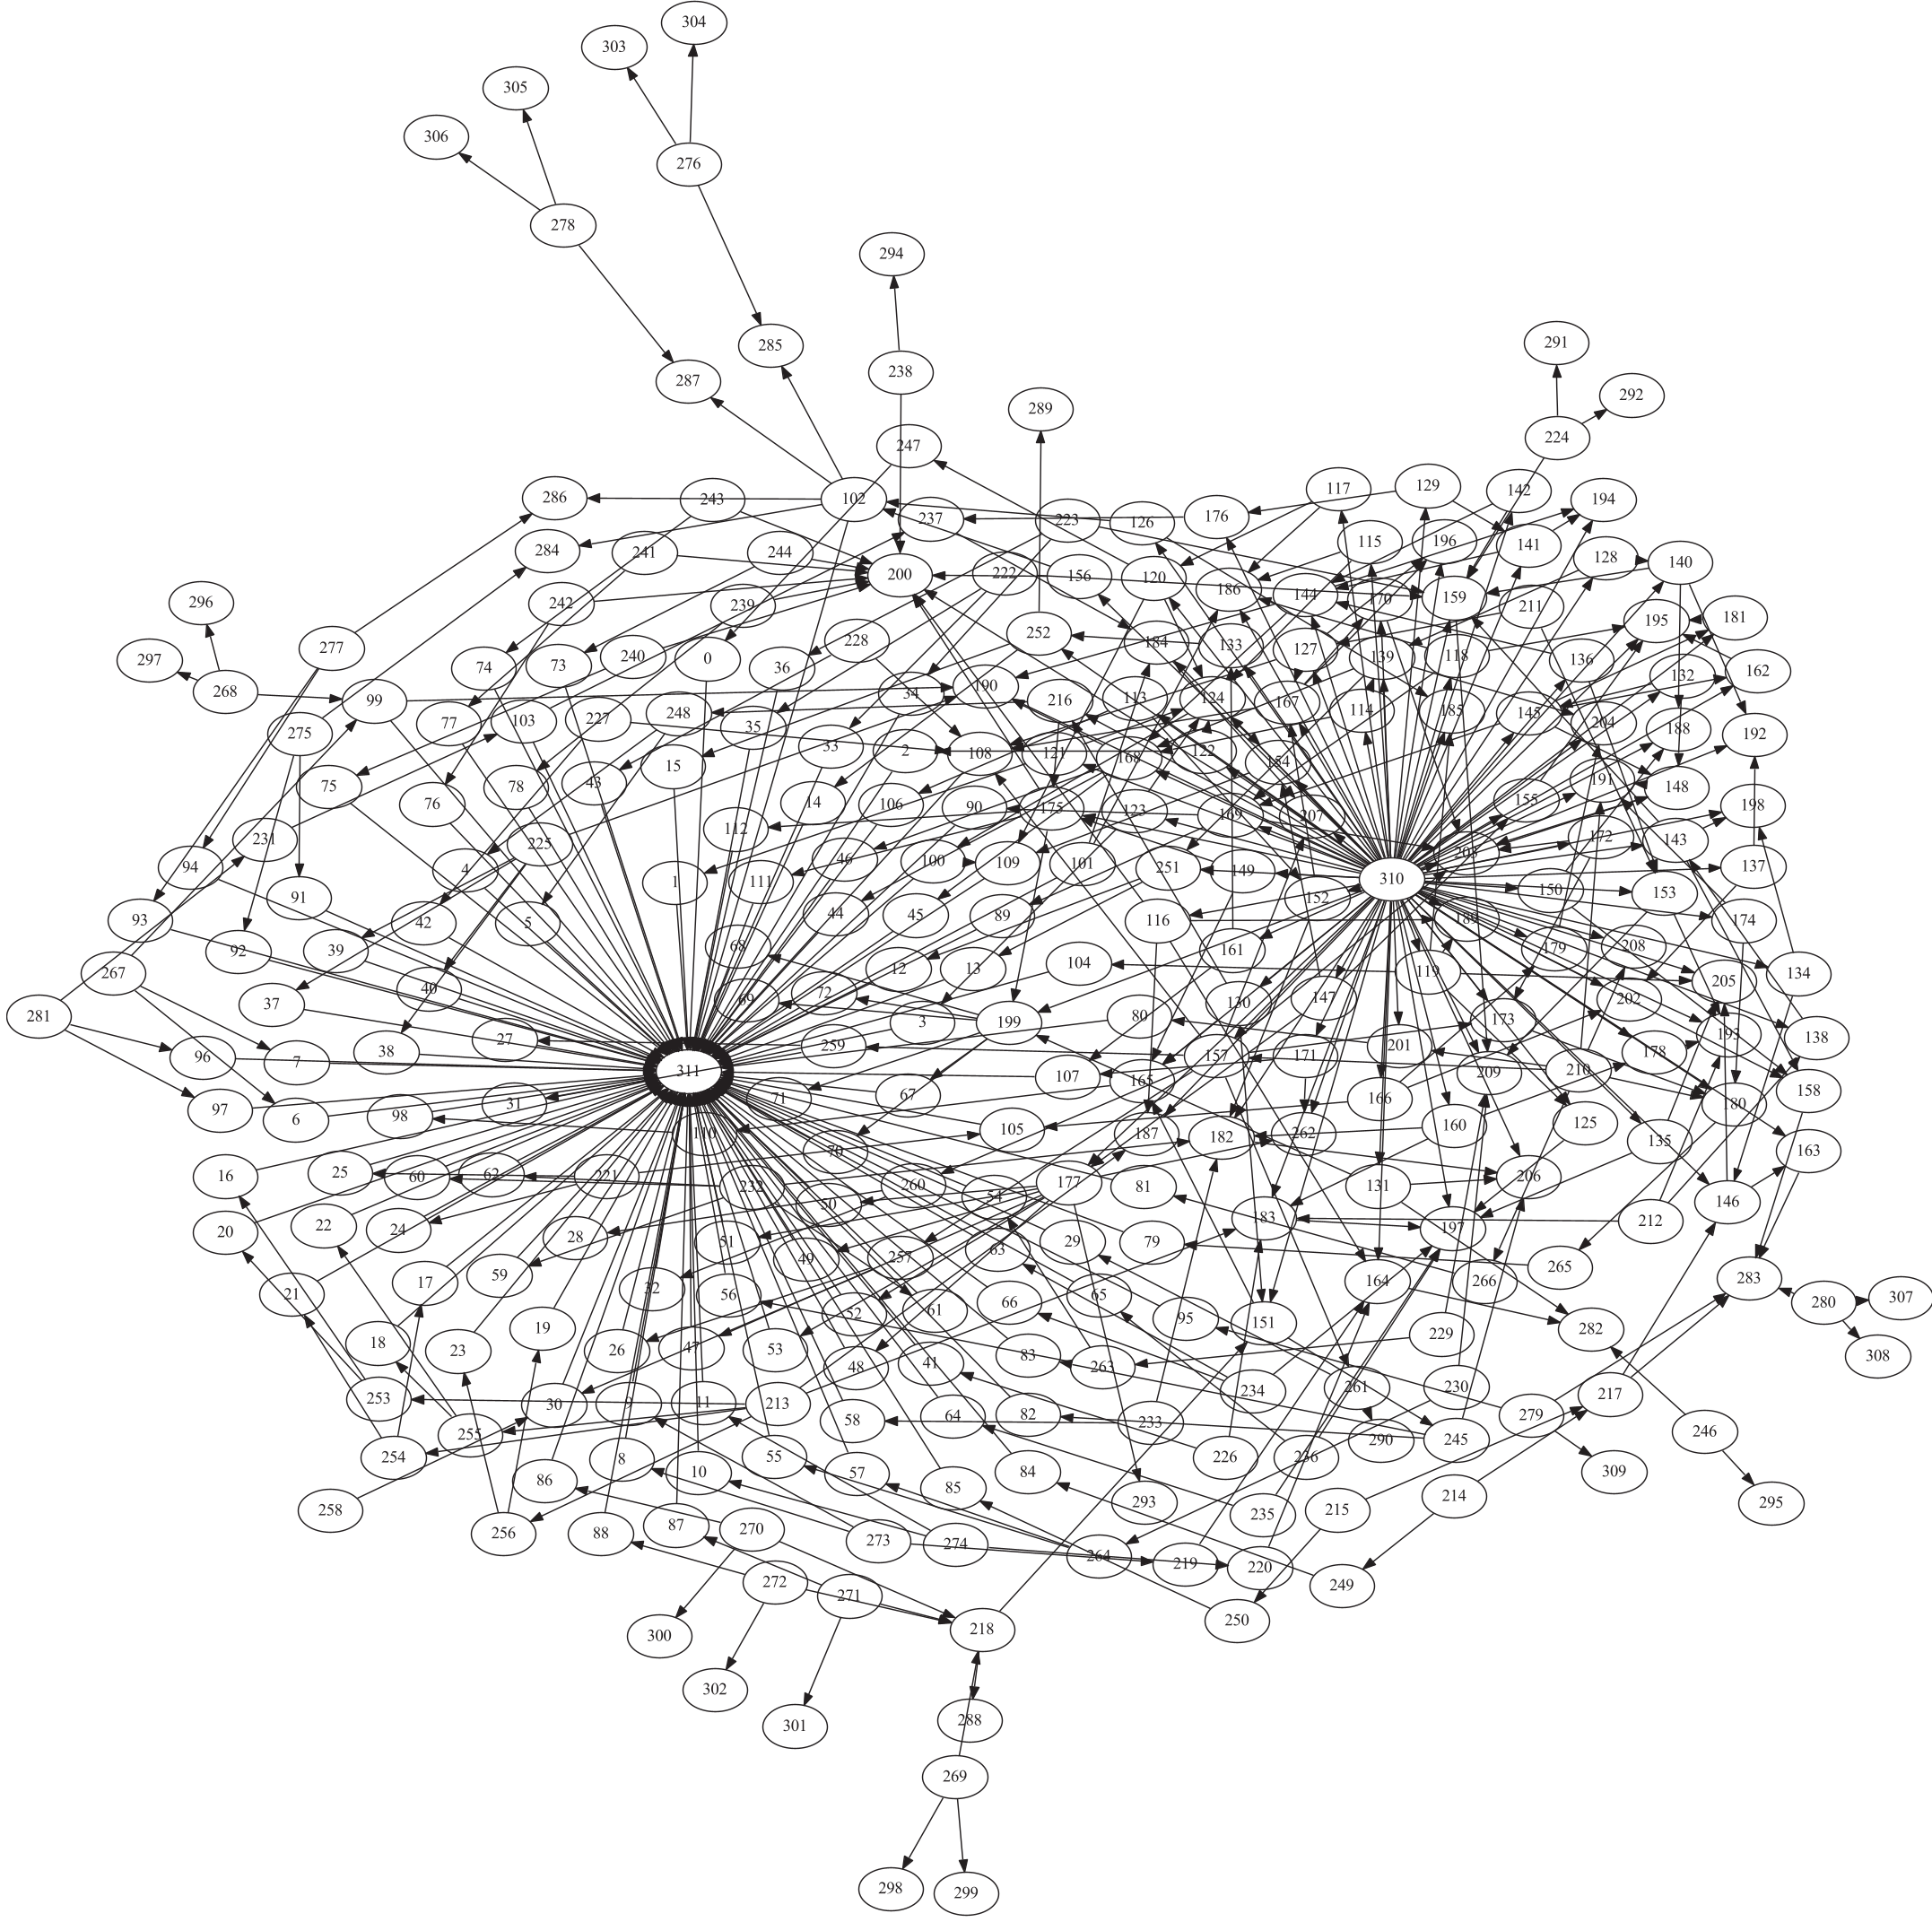 Figure 2: Reliability vs. Demand. Note how the "Maximum" function maintains high reliability significantly longer than the others.
Critical Findings:
- The "Maximum" Advantage: If actors follow the "Maximum" rule, the network is incredibly resilient to message degradation.
- Actor Sensitivity: By perturbing the network (removing specific actors), the model can rank individuals by their contribution to overall reliability. In their 13-actor experiment, "Actor 0" was identified as the "linchpin"—its removal caused the most significant drop in reliability.
Critical Analysis & Conclusion
This work successfully bridges Industrial Engineering (Reliability) and Social Science. It provides a rigorous mathematical framework for "What-if" scenarios: If I lose this informant, or if this actor becomes cynical (switches from Max to Min function), will my message still reach the target?
Limitations: The current model focuses on Directed Acyclic Graphs (DAGs). In real-world social networks, feedback loops (cycles) are common. Furthermore, the "Influence Probability Table" is currently based on expert opinion; the next frontier involves using live API data from social media to automate these probability values.
Takeaway: For decision-makers in marketing or signal intelligence, this proves that being "connected" is only the baseline. To succeed, one must analyze the reliability of the states within those connections.