
The "Buddy System" in Peer Review: Quantifying Fairness through Social Network Analysis
Social Network Analysis of Program Committees and Paper Acceptance Fairness
This paper presents a social network analysis (SNA) of program committee (PC) members and authors across 12 high-repute ACM/IEEE conferences. It evaluates "coverage bias"—the likelihood of accepting papers from the PC members' past collaborators—by comparing real-world acceptance data against artificially generated random meetings and historical benchmarks.
TL;DR
Is your paper more likely to be accepted if you've co-authored with someone on the Program Committee (PC)? This study analyzes over a decade of data from 12 top-tier computer science conferences to answer that question. By building social networks of PC members and authors, the researchers found that while some specific instances of bias exist, high-quality conferences are, on average, remarkably fair.
背景定位 (Background Positioning)
The fairness of peer review is a cornerstone of scientific progress. Biases—whether based on gender, institution, or personal connections—threaten to prioritize networking over merit. This paper moves the conversation from anecdotal "water fountain" complaints to an empirical, graph-theoretical framework, creating a baseline for what a "fair" conference network should look like.
痛点与动机 (Problem & Motivation)
The core challenge in measuring bias is the "Quality Correlation" trap:
- Top researchers are often invited to join PCs.
- Top researchers also often collaborate with other top researchers.
- Therefore, many accepted papers will naturally have authors who have collaborated with the PC.
To distinguish between "natural excellence" and "unfair favoritism," we need more than just raw numbers; we need a statistical benchmark.
方法论详解 (Methodology - The Core)
The authors define a metric called Coverage (): the ratio of accepted authors who are collaborators (neighbors in the graph) of at least one PC member.
To identify bias, they compare the real coverage () against two artificial benchmarks:
- Random Benchmark (): They create 20 fake meetings by randomly picking papers from the conference's community pool, matching the author distribution of the real meeting.
- Shifted Benchmark (): They test the current PC against authors from 3 years in the past or 3 years in the future.
架构解析 (Architecture Analysis)
The study visualizes these relationships using two types of graphs: the Social Meeting Graph (connecting people) and the PC-Papers Graph (a bipartite graph connecting PC members to specific papers).
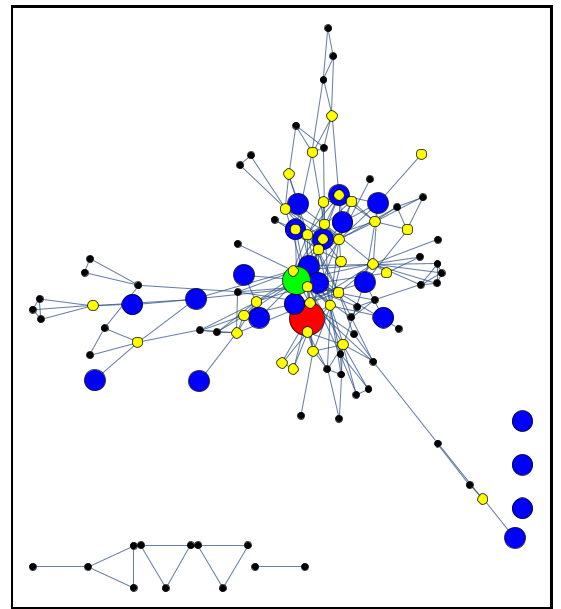 In image (a), yellow nodes represent authors connected to the PC, visually demonstrating the 'coverage' area.
实验与结果 (Experiments & Results)
1. The Verdict: Most Conferences are Fair
The study found that for conferences like KDD (-0.107 bias) and SODA (-0.081 bias), the real coverage was significantly lower than the random benchmark. This implies that these PCs might actually be over-correcting to avoid the appearance of conflict of interest.
2. The Power Shift Paradigm
An interesting discovery was the "Shift in Power" (Figure 4a). A PC typically has much higher coverage over authors from past meetings than future ones.
- Insight: This confirms a healthy academic lifecycle: Juniors enter a community collaborate with seniors eventually become seniors who serve on the PC.
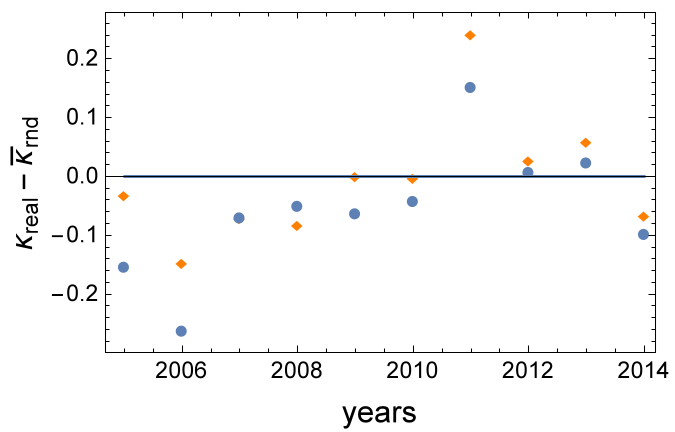 The downward slope shows that PCs are naturally more connected to the 'history' of the conference than its 'future'.
3. Case Study of a Biased Meeting
Even in a fair system, outliers exist. The authors highlighted one specific meeting (Figure 2a/4c) where the coverage was significantly higher in reality than in any artificial simulation. This "spike" serves as a diagnostic tool for chairs to evaluate if their selection process was compromised.
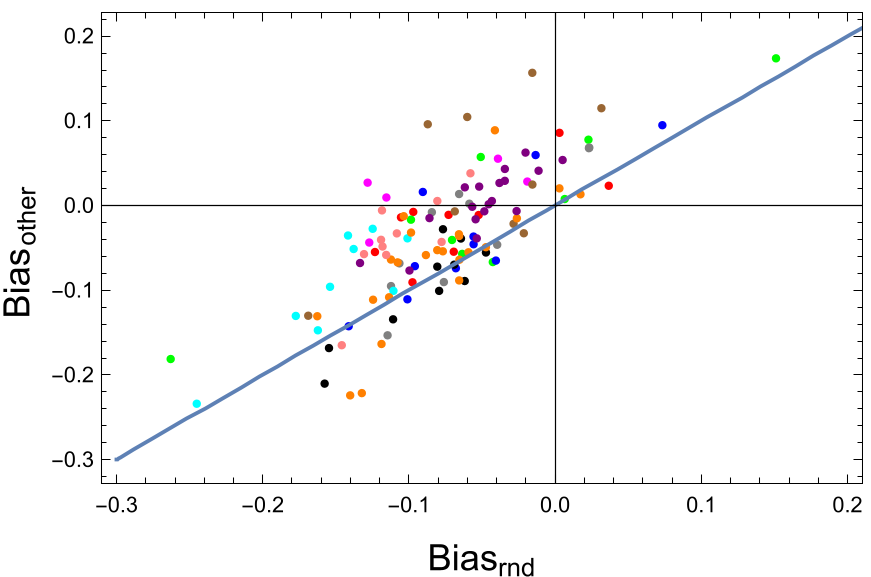 Figure 6 shows the high agreement between the 'random' and 'other year' methods in identifying biased vs. fair meetings.
深度洞察与总结 (Critical Analysis & Conclusion)
Takeaway
The study concludes that "favoritism" is not the driving force behind most high-repute CS conferences. The social network of science is dense, but the peer-review process generally filters for quality effectively.
Limitations
- Implicit Bias: The study only tracks co-authorship. It cannot detect biases based on nationality, gender, or institutional prestige that don't involve direct collaboration.
- Quality Metadata: The authors assume random papers have the same quality distribution as accepted ones, which may not always hold true.
Future Outlook
This methodology provides a "Fairness Dashboard" for conference chairs. In the future, such SNA tools could be integrated into submission systems (like CMT or OpenReview) to provide real-time alerts if a selection process deviates too far from established "fairness" baselines.