
The Global Market Web: Identifying the "Influencers" of High-Finance
A Social Network Approach to Examine the Role of Influential Stocks in Shaping Interdependence Structure in Global Stock Markets
This paper introduces a Social Network Analysis (SNA) framework to identify influential stocks and analyze the global stock market's interdependence structure. By employing centrality measures and Minimum Spanning Trees (MST) on a dataset of 3566 stocks, it demonstrates how a small subset of dominant stocks integrates the global financial system.
TL;DR
Financial markets are more like social networks than we think. This paper moves beyond traditional "Market Cap" metrics to rank stocks based on their linkage influence. By analyzing 3,566 stocks globally, the researchers found that geographical ties—not industry sectors—are the strongest magnets for market behavior, and that a tiny group of influential stocks (primarily in the UK) acts as the nervous system for global capital.
Problem & Motivation: Beyond the Balance Sheet
Why does a crash in New York ripple through Tokyo and London in seconds? While the Efficient Market Hypothesis (EMH) suggests prices reflect all info, it doesn't explain the structural topology of how that information travels.
Typically, investors look at a company’s size to judge its importance. However, the authors argue that this ignores interdependence. A mid-sized European stock might be more "central" to the global flow of correlations than a massive US tech giant. The study aims to map this "social network of stocks" and see how it holds up during a crisis, such as the 2008 collapse of Lehman Brothers.
Methodology: Mapping the Financial Nervous System
The researchers treated stocks as nodes and their price correlations as edges. To clean up the noise, they used Minimum Spanning Trees (MST)—a method that simplifies a dense web into a skeletal structure showing only the most vital pathways.
The Centrality Scorecard
To identify "Influential Stocks," the authors didn't just count connections. They combined four heavyweight Social Network Analysis (SNA) metrics:
- Degree Centrality: Direct links to other stocks.
- Betweenness: How often a stock acts as a bridge between two other groups.
- Closeness: How easily a stock's movement propagates to the entire system.
- Eigenvector: Not just who you know, but how important your "neighbors" are.
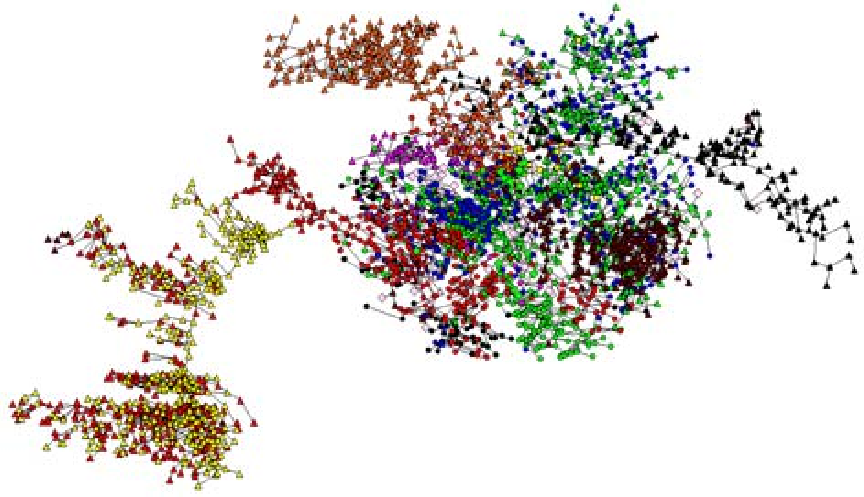 Figure 1: MST showing how stocks cluster. Note the dominance of shape (Geography) over specific indices.
Experiments & Results: Geography > Sector
One of the most striking findings is the "Localization of Correlation." You might expect all Energy stocks or all Tech stocks to cluster together regardless of where they are. Instead, the MST analysis showed that a German industrial stock is more likely to move with a German bank than with a US industrial peer.
The Lehman Shock
The researchers used a sliding window of 119 periods to track the network's evolution. When Lehman Brothers collapsed, the "length" of the network shrunk. In network science, a shorter MST means higher correlation. Essentially, the world's stocks "clamped together" in a synchronized panic.
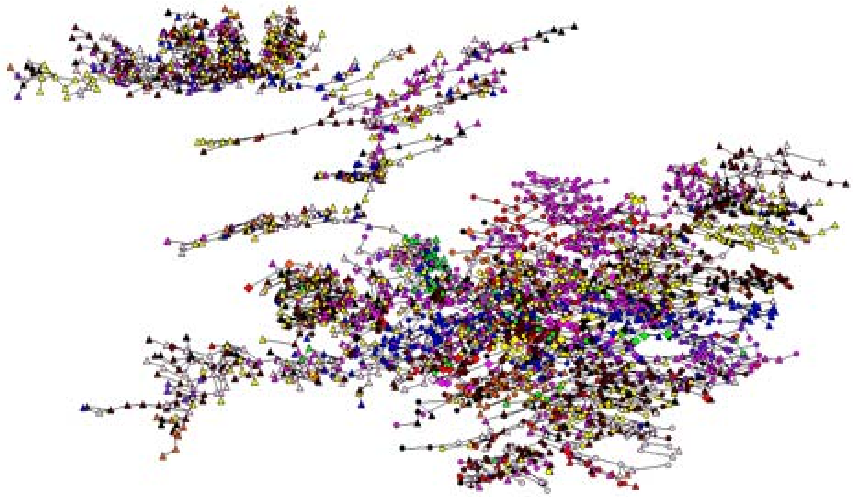 Figure 2: Color represents sectors, shapes represent geography. The clustering of shapes confirms that where a company is matters more than what it makes.
The Top Influencers
The paper identified the top 10 most influential stocks during the crisis. Surprisingly, the list was dominated by UK-listed investment trusts (like WTAN LN and SCIN LN). These entities, which hold diverse global assets, act as the "super-connectors" of the financial world.
Critical Insight: The Regulatory Takeaway
This research shifts the perspective on Systemic Risk. If we only monitor "Too Big to Fail" banks, we might miss "Too Connected to Fail" nodes.
Key Takeaways:
- Regional Dominance: Global markets are a "network of regions" rather than a "network of industries."
- The Hub Effect: A tiny set of 50 stocks provides the necessary linkages to integrate thousands of others into a single global system.
- Dynamic Ranks: While the top-tier influencers are relatively stable, a crisis causes a reshuffling of middle-tier stock influence, changing how risk spreads.
Future Outlook
While this paper uses data ending in 2011, its methodology is a blueprint for modern "Crisis Informatics." Applying this to the COVID-19 market shock or the current AI-driven tech rally could reveal if our "super-connectors" have shifted from London investment trusts to Silicon Valley platforms.