
Evaluating Micro-blogging Marketing: An AISAS and Social Network Integration
Based on the Social Network Evaluation Model of Short-Term Interaction with Followers Micro-Blogging Marketing
The paper introduces a quantitative evaluation model for Sina Micro-blogging marketing based on the AISAS (Attention-Interest-Search-Action-Share) framework. By integrating social network analysis (SNA) and first-order autoregressive regression, it identifies key opinion leaders (KOLs) and measures marketing influence through follower dynamics and interaction centrality.
TL;DR
This research bridges the gap between qualitative marketing theory and quantitative data science. By leveraging the AISAS model (Attention-Interest-Search-Action-Share), the authors propose a regression-based framework to measure the impact of micro-blogging campaigns. Through Social Network Analysis (SNA), they prove that the "power" of a marketing campaign isn't just about follower count, but the structural centrality of identity-verified "star nodes" within the network.
Problem & Motivation: The Failure of Linear Funnels
Since 1898, the AIDMA model (Attention, Interest, Desire, Memory, Action) has dominated marketing strategy. However, the rise of platforms like Sina Micro-blogging (the Chinese equivalent of X/Twitter) has fundamentally changed consumer behavior.
The authors argue that:
- Passive Reception is Dead: Consumers now actively Search and Share information, creating a feedback loop that AIDMA cannot describe.
- The "Follower" Illusion: Many companies focus on raw follower counts, yet many of these accounts are "spam" or "inactive," providing zero structural value to information dissemination.
- Complex Dynamics: Marketing influence is a time-sensitive, decaying variable that requires more than just simple correlation to understand.
Methodology: Quantifying Influence
The researchers propose a two-pronged approach: a Mathematical Regression Model to track influence over time and Centrality Analysis to map the social fabric.
1. The Autoregressive Model
To solve the problem of multicollinearity (where the number of posts and followers are too closely related to separate their effects) and time-lagged influence, the authors use a first-order autoregressive model:
- : Brand initial influence.
- : Natural attenuation (decay) coefficient.
- : The interaction amplification factor.
2. Social Network Centrality
The paper uses the UCINET tool to map nodes based on three metrics:
- Point Centrality: Direct power (who has the most followers).
- Betweenness Centrality: Control power (who acts as a bridge between different social circles).
- Closeness Centrality: Independence (how quickly a node can access information without midpoints).
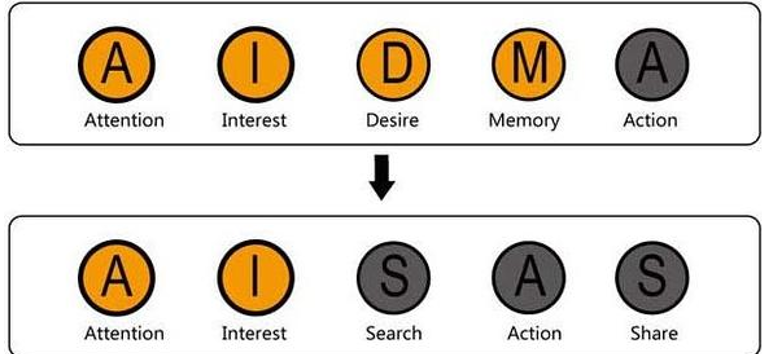 Figure 1: The structural shift in consumer behavior in the Web 2.0 era.
Experiments & Case Studies
The study analyzed six major marketing events, including "FAW-Audi," "Dell China," and "Changan Ford."
| Campaign | (Retention) | (Impact) | |
|---|---|---|---|
| Changan Ford | 13.168 | 0.830 | 0.013 |
| Yang Mi World II | -875023.4 | 0.389 | 2.174 |
| Everbright Bank | -2283.1 | 0.915 | 0.209 |
Key Findings:
- Celebrity Power: The "Yang Mi" case showed an of 2.174, nearly 10x higher than standard corporate campaigns. This proves that "Key Nodes" (KOLs) with high centrality are the primary drivers of short-term viral spread.
- Filtering the Noise: By applying rules to exclude spam accounts (e.g., users whose "following" count is 4x their "followers"), the authors identified that true influence lies in nodes like "Angelababy" and "Wenle Yu," who maintain high In-degree and Betweenness scores.
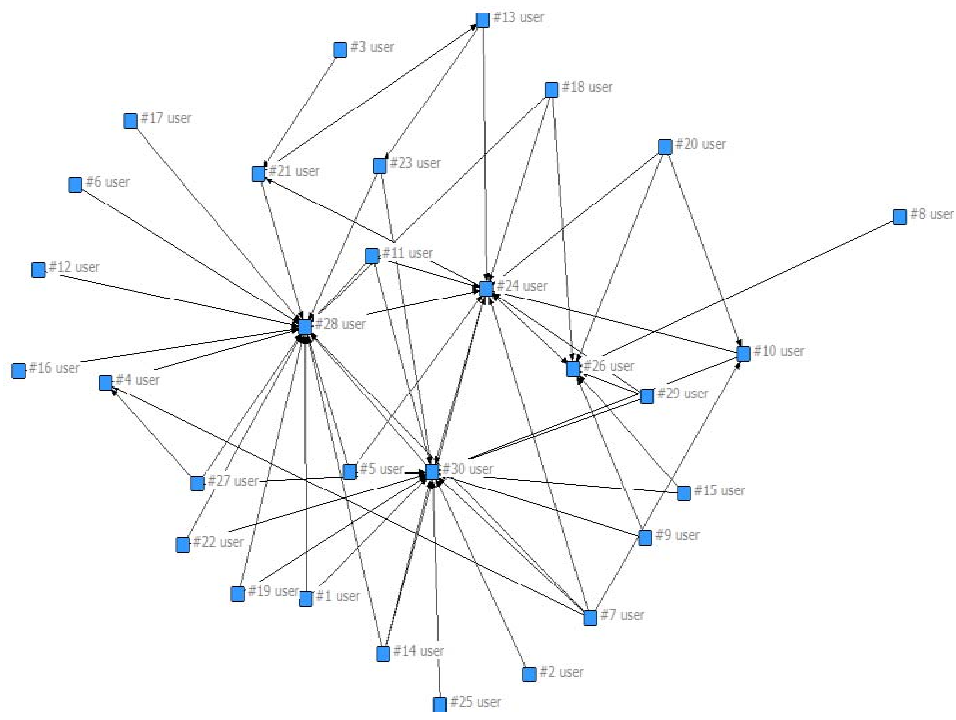 Figure 2: Social network topology visualization showing the "power nodes" in the Audi Q3 campaign.
Critical Analysis & Conclusion
Takeaways for Industry
- Quality over Quantity: Purchasing fake followers is mathematically proven to be useless in this model as it doesn't improve .
- Strategic Contracts: Companies should not just pay KOLs for a single post but should contractually ensure forwarding frequency and interaction depth to maintain the "Betweenness" of the node.
- Content matters: Similar or repetitive tweets cause users to lose interest, leading to higher attenuation ( decay).
Final Thoughts
While the model provides a robust quantitative baseline, it currently treats all social media platforms as equal. Future iterations should incorporate Complex Network Theory to account for the unique algorithmic biases of different platforms and the sentiment of the interactions (Share vs. Negative Share).
Author Note: This blog post is based on the research by Shuai Shao and Cheng Li regarding the evaluation of short-term interaction in social network marketing.