
KIWI: Visualizing the Hidden Architecture of Knowledge Sharing
Promoting social network awareness: A social network monitoring system
The paper introduces the KIWI (Knowledge Interactions to Work and Innovation) system, a social network monitoring tool designed to enhance social network awareness within distributed research communities. It combines an active data gathering mechanism with Social Network Analysis (SNA) visualizations to map "who knows whom" and foster informal knowledge sharing.
TL;DR
Knowledge in research communities is often implicit and highly social. The KIWI system (Knowledge Interactions to Work and Innovation) addresses the isolation of distributed researchers by asking them to register their weekly interactions, then feeding back a map of their community’s social fabric. The results prove that simply witnessing the network can significantly boost social awareness and motivation to collaborate.
The "Who Knows Whom" Problem
In distributed R&D environments, knowing what someone knows is useless if you don't know how to reach them or who acts as a bridge to that person. This is the distinction between Human Capital (individual expertise) and Social Capital (the value within connections). Most virtual environments focus on the former, leaving researchers—especially beginners—feeling isolated. The authors argue that the missing link is Social Network Awareness: a clear understanding of the evolving interpersonal relationships within a group.
Methodology: Human-Centric Data Gathering
Unlike systems that passively scraper emails or chats, KIWI asks users to be active participants. This "filtering strategy" ensures that only meaningful knowledge-sharing interactions are recorded.
1. The Gathering Tool
Users are presented with a simple, photo-based interface where they select community members they collaborated with. The system remembers a user's "frequent flyer" list to minimize the intellectual load, reducing reporting time to under 2 minutes per week.
2. The Visualization Tool
This is where the raw data turns into "Social Capital." The system generates:
- Network Diagrams: Visual maps where nodes represent researchers and arrows show the direction of knowledge flow.
- Quantitative Metrics: Bar charts showing individual vs. group activity, categorized by seniority (Supervisors vs. Students) and location (Local vs. Remote).
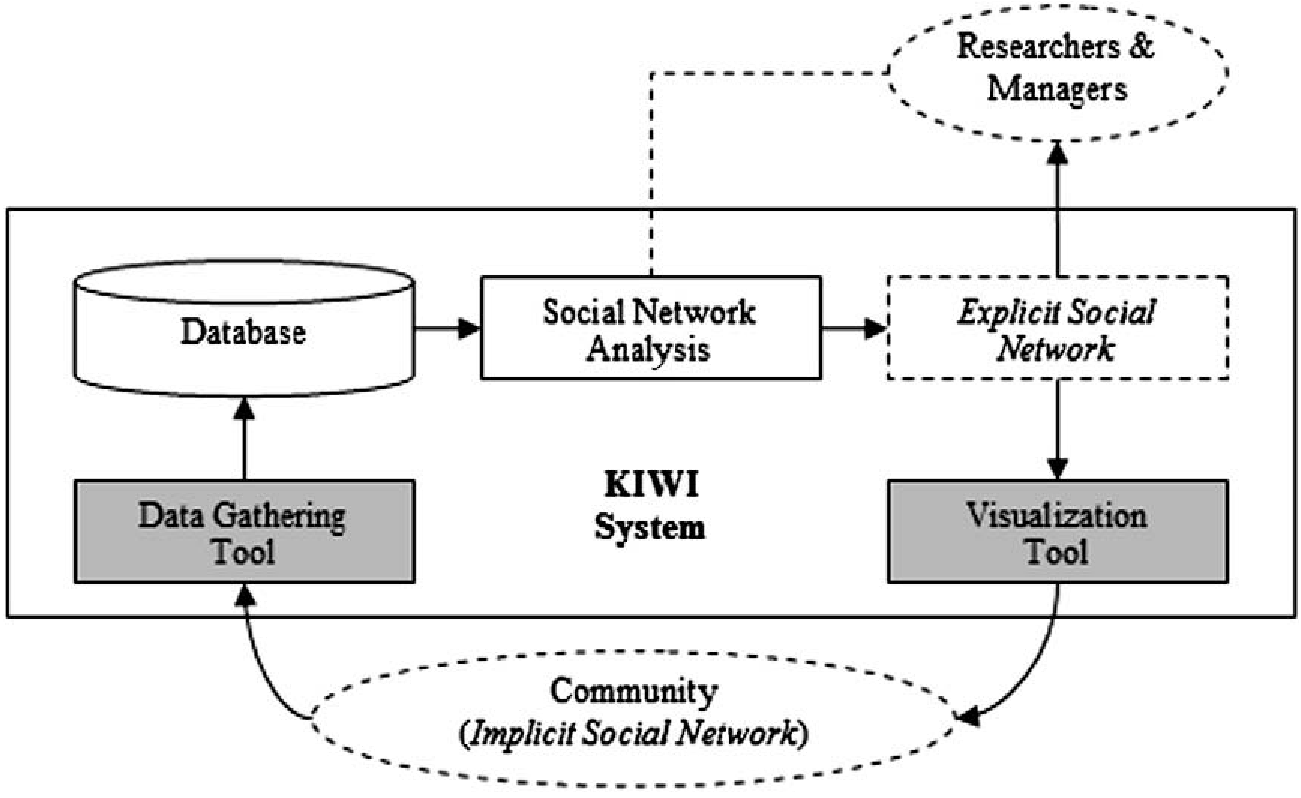 Figure 1: The conceptual model of the KIWI system, balancing user input with analytical feedback.
Experimental Insights: The Perception Gap
The system was deployed for 8 weeks within a PhD community spanning multiple countries (Spain, Mexico, USA, etc.).
Key Findings from Social Network Analysis:
- Cohesion vs. Isolation: The local Barcelona-based group formed a highly dense, non-hierarchical core (density 0.55), while distance-based researchers were more prone to isolation.
- The Bridge Builders: Using "Betweenness" metrics, the system identified specific individuals—some even in the distance group—who acted as vital gateways between disconnected sub-groups.
- The Acknowledgment Mismatch: One of the most striking findings was that only 40.3% of interactions were reported by both parties. Receivers were much more likely to report a knowledge transfer than givers, likely because givers often provide "tacit" knowledge without realizing its value to the other person.
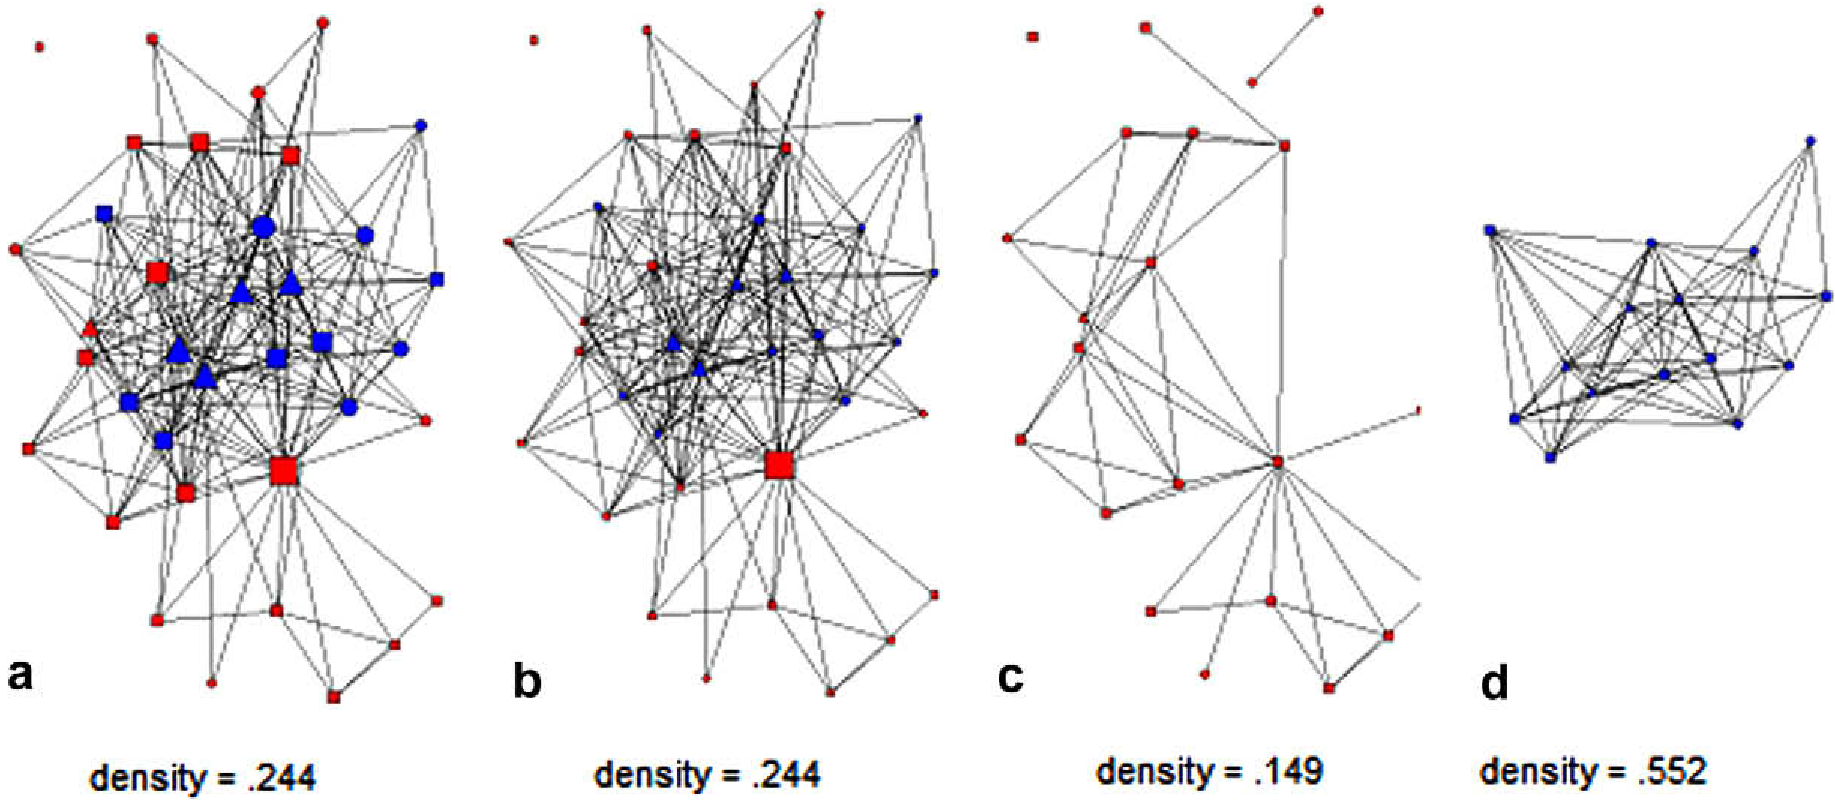 Figure 2: Community network maps where node size represents Degree (connections) and Betweenness (bridge-building potential).
Critical Analysis & Takeaways
The KIWI system demonstrates that "making the invisible visible" has a psychological impact. 87% of users felt the reflection required to use the tool made them more aware of their role. However, the study also highlights a "Visualization UX" challenge: 27% of users struggled to interpret the complex SNA graphs, suggesting that for awareness systems to work at scale, we must simplify the representation of complex social data.
Future Outlook: As we move toward AI-integrated workspaces, tools like KIWI could evolve into "AI Social Advisors," suggesting potential collaborators not just based on their skills, but on the "closeness" and "accessibility" of their social position within the organization.
Conclusion
KIWI isn't just a monitoring tool; it's a mirror. By forcing a weekly moment of reflection on "who helped me" and "whom did I help," it builds a more conscious, connected, and ultimately more innovative community.