
Decoding the Web of Software Risks: A Social Network Perspective
A Social Network Approach to Software Development Risk Correlation Analysis
This paper proposes a Social Network Analysis (SNA) framework to quantify software development risk correlations. By combining meta-analysis and co-word analysis on text data from 56 major publications, the study constructs an objective risk correlation network to identify core risk factors and their interdependencies.
TL;DR
This research transforms thousands of qualitative risk descriptions from 30 years of academic literature into a quantitative Social Network. By moving beyond simple checklists to analyze how risk factors like "Requirements" and "Change" interact, the authors provide a roadmap for project managers to identify which risks are likely to trigger others.
Background & Motivation: Moving Beyond Subjectivity
In the world of software development, risk factors rarely act in isolation. A delay in "Requirements" often cascades into "Design" flaws and "Schedule" overruns.
However, traditional risk assessment has two major flaws:
- Linearity: Statistical models often assume simple linear relationships.
- Subjectivity: Most checklists are based on the gut feelings of a small group of experts at a specific point in time.
The authors argue that software risk is inherently social and empirical. Therefore, they treat risk factors as "actors" in a network, where a "connection" exists if two risks are mentioned together in the same project context.
Methodology: From Text to Topology
The researchers employed a rigorous three-step process:
- Meta-Analysis: They scanned engines like IEEE and ACM, gathering 56 top-tier publications to build a corpus of 1,932 risk-related sentences.
- Co-word Analysis: They identified 55 high-frequency "risk words." If two words appeared in the same description, a link was formed.
- SNA (Social Network Analysis): Using tools like Ucinet, they mapped these links to measure which risks are the "influencers" (Centrality) and which ones form the "heart" of project failure (Core/Periphery).
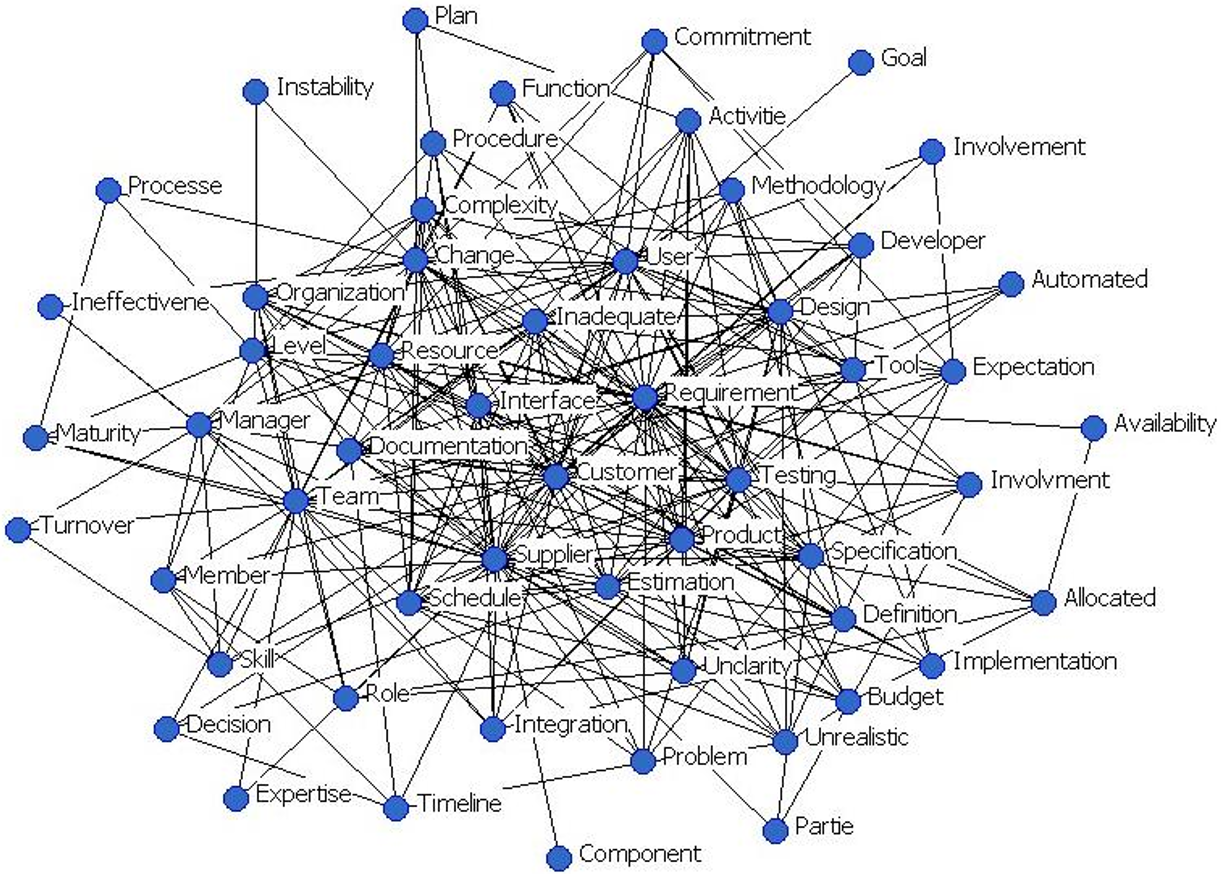 Figure 1: The visual landscape of software risk connections. Central nodes represent the most pervasive issues.
Key Insights: The Anatomy of a Software Crisis
1. The "Requirement-Change" Nexus
The data confirms the industry's biggest nightmare: "Requirement" and "Change" have the strongest bond in the network (41 co-occurrences). As the authors note, a "continuous stream of requirements changes" is the most significant bridge to other risks.
2. Ego-Network Analysis
By looking at a node's "Ego-Network" (its immediate neighborhood), the study found that Requirement has the largest size (connected to 35 other risks), but Schedule has the highest density. This means that once a schedule risk appears, it is almost certain to be tightly coupled with multiple other compounding failures.
3. Core vs. Periphery
The network is not a flat structure. It has a powerhouse "Core" consisting of five nodes:
- Requirement
- User
- Change
- Design
- Customer
These five factors are so tightly linked that they cannot be separated into distinct sub-problems. If you fail to manage one, the others will likely follow.
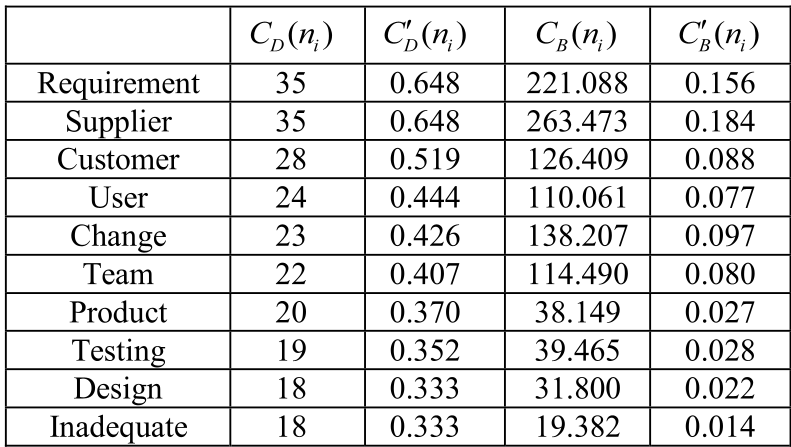 Table 1: Centrality metrics showing that "Supplier" and "Requirement" hold the most structural power in the risk network.
Critical Analysis: Why This Matters
The metric of Betweenness Centrality is perhaps the most useful for practitioners. A node with high betweenness (like "Change") acts as a bridge. In a project, managing these "bridge" risks is more effective than trying to fix every tiny peripheral issue. By "breaking" the bridge, you prevent a local requirement issue from becoming a global project collapse.
Limitations
- Time Span: The data ranges up to 2009. The rise of Agile, DevOps, and AI-driven development might have introduced new "core" nodes (like "Security" or "API Integration") not captured in this legacy dataset.
- Weighting: The model treats all co-occurrences as equally important, whereas in reality, some risk pairs might be more lethal than others.
Conclusion
This paper shifts software risk management from a "list-checking" exercise to a "network-monitoring" strategy. For project managers, the message is clear: don't just watch the frequency of risks—watch the connections. If your "Requirement" and "Customer" nodes are showing high activity, the entire core of your project is at risk of a chain reaction.