
Deciphering Social Dynamics: Trend Analysis via Frequent Pattern Mining and SOM
Social Network Trend Analysis Using Frequent Pattern Mining and Self Organizing Maps
This paper introduces a robust framework for detecting and analyzing temporal trends in social networks by combining an extended Frequent Pattern Mining (FPM) algorithm, TM-TFP, with Self-Organizing Maps (SOM). The method successfully identifies "interesting" behavioral shifts in large-scale datasets, such as the UK Cattle Tracing System (CTS) and car insurance databases, by clustering similar support-value sequences.
TL;DR
Understanding how social networks "breathe" over time requires more than static graph snapshots. This paper presents a sophisticated methodology that extracts frequent patterns, transforms them into temporal support sequences (trends), and clusters them using Self-Organizing Maps (SOM). By treating the UK Cattle Tracing System (CTS) as a massive social network, the authors demonstrate how to detect "behavioral migrations"—shifts in how entities interact across years.
Background & Positioning
In the academic landscape of data mining, we often distinguish between pattern discovery and trend analysis. This work bridges that gap. It positions itself as a dynamic mining solution that moves beyond "what is frequent" to "how does the frequency of what is frequent change?" It is particularly relevant for sectors like agriculture, insurance, and logistics where "nodes" (farms or zip codes) and "links" (animal movements or quotes) form a complex, time-evolving web.
The Core Challenge: The "Pattern Explosion"
The authors identify a classic bottleneck in Frequent Pattern Mining (FPM): at lower support thresholds, the algorithm generates thousands—even millions—of patterns. For a human decision-maker, this is noise.
The Research Intuition here is brilliant: if we treat the support of a pattern over 12 months as a 12-dimensional vector, we can use dimensionality reduction to group "look-alike" trends. If two patterns both spike in spring and dip in winter, they belong in the same cluster, regardless of what they actually represent.
Methodology: TM-TFP and the SOM Pipeline
1. TM-TFP (Trend Mining - Total from Partial)
The authors extended the standard TFP algorithm. While the original TFP uses P-trees and T-trees for fast counting, TM-TFP introduces a temporal dimension. It stores a sequence of support values for each pattern across different epochs.
2. SOM Clustering
To make sense of the results, a SOM is used.
- Training: The SOM is trained on the first epoch (e.g., 2003 cattle data) to create a "prototype map" of possible trend shapes.
- Mapping: Trends from subsequent years are then projected onto this map.
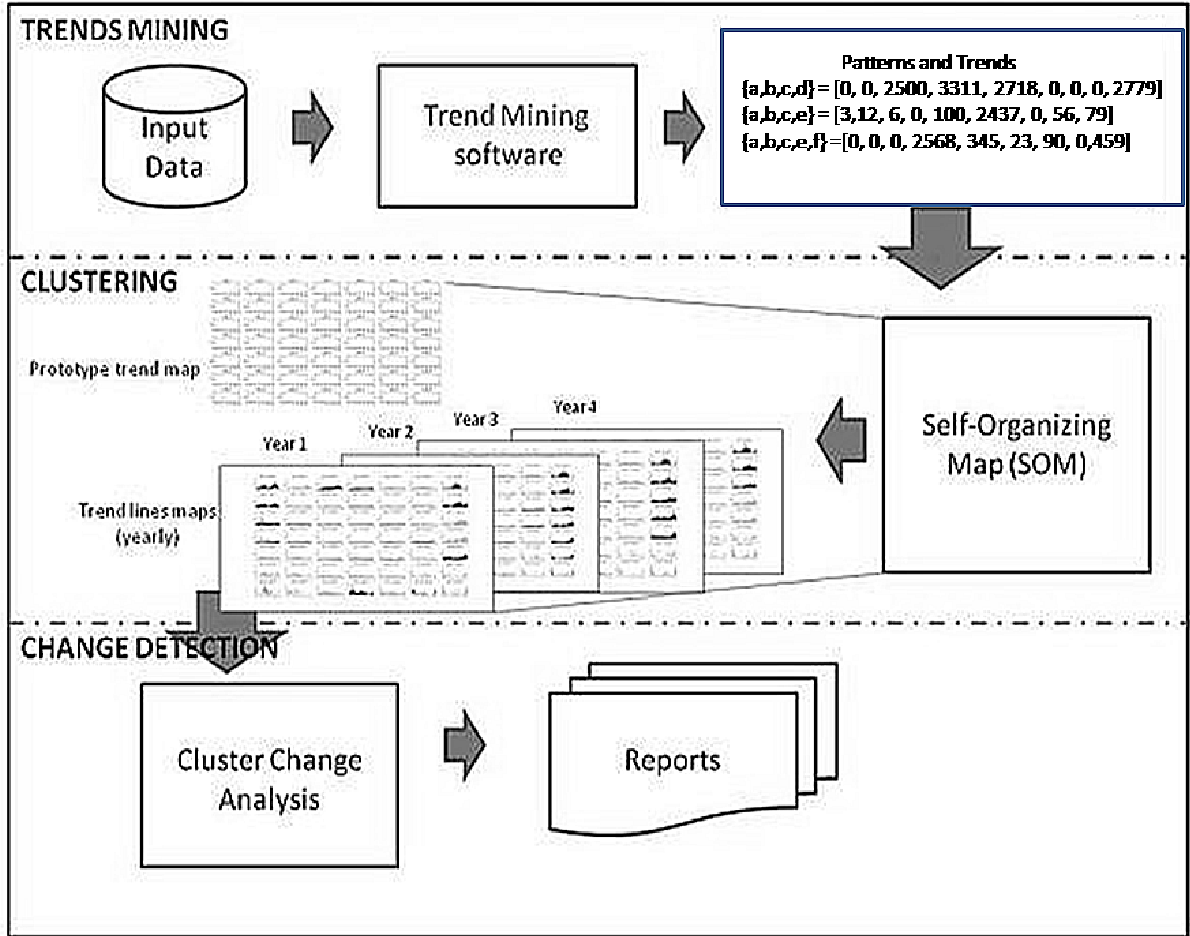 Figure 1: The overarching process from raw data to cluster movement analysis.
Visualizing "Interesting" Changes
The most innovative part of the methodology is identifying Trend Migration. By calculating the Euclidean distance between a pattern's position on the 2003 map versus the 2004 map, the authors can mathematically flag patterns that are "moving."
Experimental Evidence: Cattle & Insurance
In the CTS database, the system analyzed cattle movements across Great Britain.
- Complexity: Managed roughly 25,000 to 66,000 trends per year.
- Insight: Certain movement patterns (e.g., young females moved between specific agricultural holdings) migrated between clusters, indicating a change in farming practices or legislative impact.
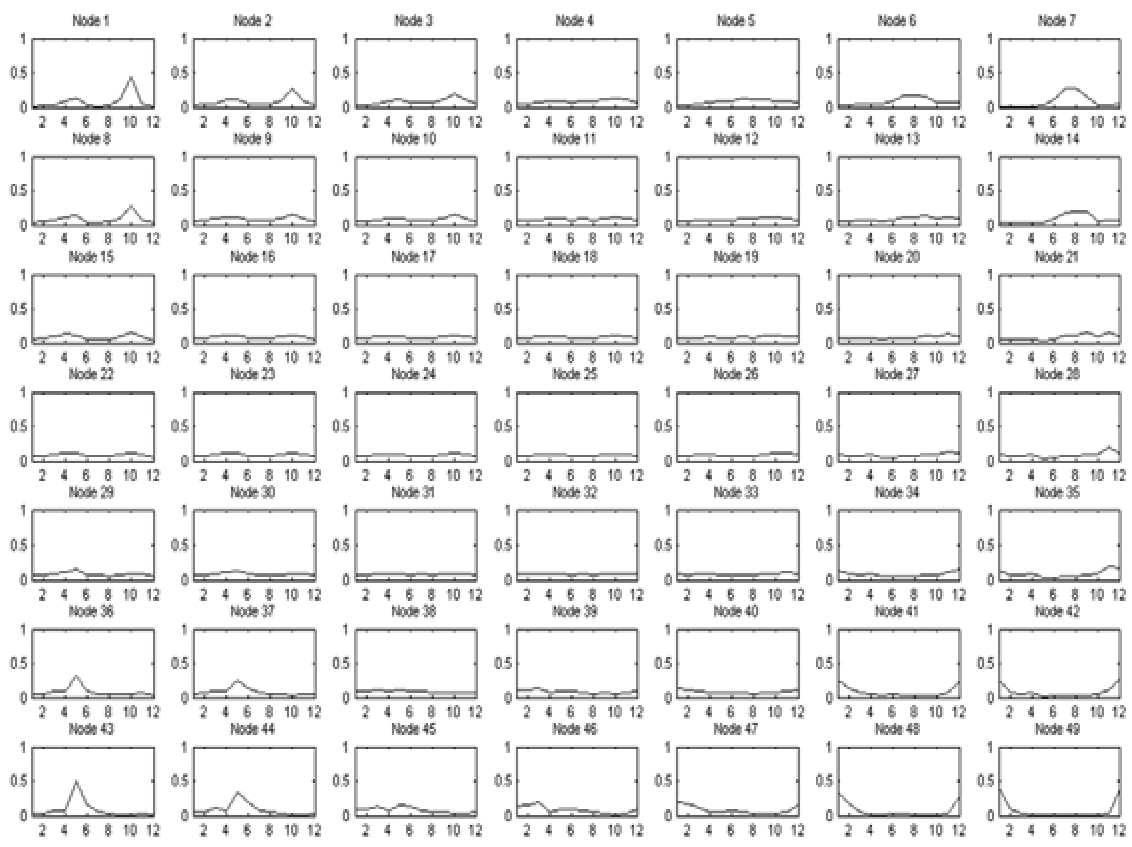 Figure 2: The CTS Prototype Map showing different trend contours (e.g., spring/autumn peaks).
In the Car Insurance evaluation, the "star network" analysis showed patterns shifting from September peaks (Node 43) to February peaks (Node 11), providing actionable intelligence for insurance adjusters regarding seasonal risk.
Critical Insight: Why This Works
The beauty of using SOM in this context is its topographic preservation. Similar trend lines stay close to each other. When a pattern "jumps" across the map, it represents a fundamental change in the underlying social behavior.
Limitations
- Support Threshold Sensitivity: While the paper explores different supports, the "exponential" growth of patterns suggests a scalability limit for very dense networks.
- SOM Grid Size: The grid is arbitrary; as the authors note, there is currently no "scientific method" for determining the optimal dimensions for trend clustering.
Conclusion & Future Outlook
This work demonstrates that social networks are not just about who knows whom, but when and how often they interact. By marrying TM-TFP with SOM, the researchers have provided a lens to view the "heartbeat" of a network. For future research, integrating this with Deep Temporal Graph Networks could further automate the feature extraction process that TFP currently handles via thresholds.