
Geometric Social Mapping: Beyond 2D Graphs to 3D Relationship Polyhedrons
The follow relationship model of social networks: Construction and visualization
The paper proposes a precise mathematical model for social networks based on public "follow" relationships. It introduces a multi-layered quantification algorithm to calculate user closeness and a 3D visualization method that maps these relationships into a geometric polyhedron.
TL;DR
This research moves away from analyzing "what people say" (content analysis) to "who people follow" (structural analysis). It introduces a rigorous matrix-based framework to quantify social closeness across multiple layers of influence and maps these interactions into a 3D space, resolving the visual clutter of traditional 2D social graphs.
Background: The Limits of Content-Based Analysis
Most social network analysis relies on natural language processing (NLP) to gauge user relationships. However, this is fraught with privacy issues and high computational costs. The author argues that follow relationships are public, transparent, and provide a more stable foundation for mathematical modeling. The challenge lies in quantifying the "strength" of a follow—especially when influenced by mutual connections—and visualizing that strength intuitively.
Methodology: Quantifying Closeness through Multi-Layered Matrices
The core of the paper is a multi-step algebraic process:
- The Follow Matrix (): A simple binary matrix where if user follows user .
- The Multi-Layered Relationship Matrix (): This introduces the "mediate influence." If and both follow , their relationship is stronger. The formula uses a custom operator to identify these shared connections across layers.
- Distance Scaling: Closeness is inversely proportional to distance. The paper defines a Distance Matrix () where represents the spatial gap between users.
The Visualization Pipeline
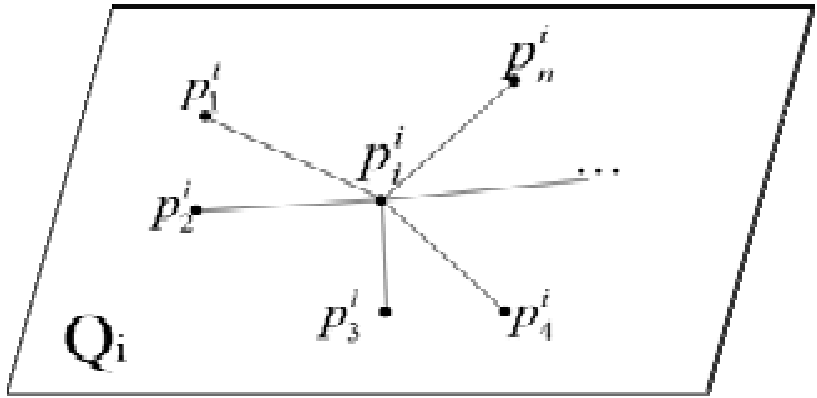
To solve the "spatial crowding" of 2D diagrams, the author proposes the Relationship Polyhedron. Each user acts as the center of a 2D "Relationship Diagram," and these diagrams are enclosed to form a 3D shape.
Solving the "Redundancy" Problem
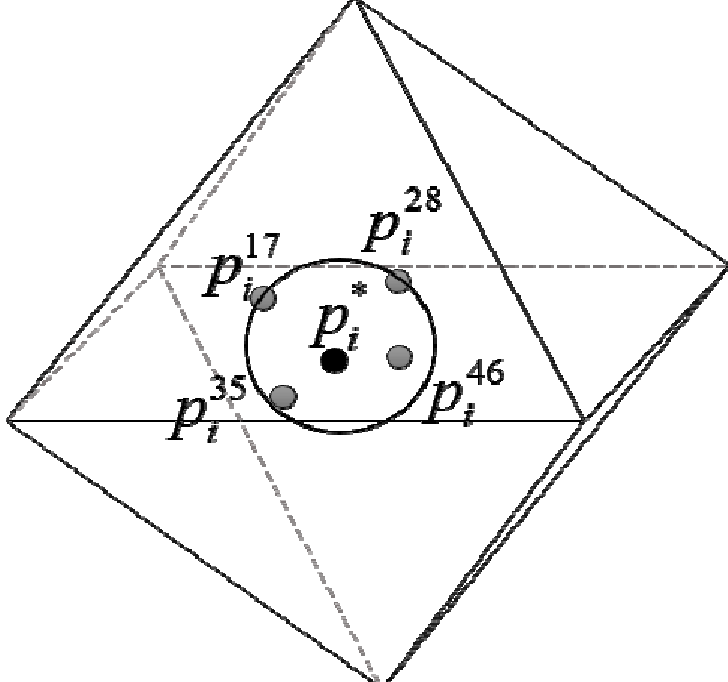
As the number of users () increases, the geometric constraints between points become over-determined. You cannot satisfy all distances perfectly in 3D space once .
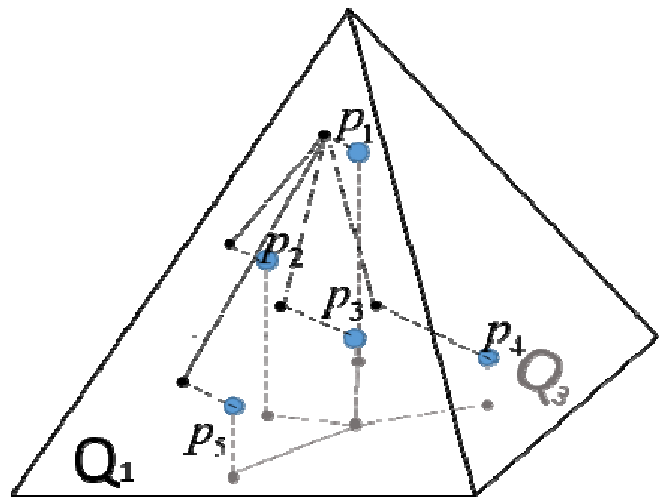
The author introduces a Correction Algorithm. By calculating "normals" (perpendicular lines) from the sub-points on the polyhedron's faces, the method identifies a central point in 3D space that minimizes the theoretical deviation from all projected relationship diagrams.
Application Example: A 5-User Social Microcosm
The theory was tested on a small network where users had varying degrees of mutual and directed follows. By setting a coefficient set , the model could weigh direct follows more heavily than second-layer influences. The final result transformed an abstract matrix into a 3D pyramid (four-sided polyhedron), where the physical distance between vertices represented the calculated social distance.
Critical Insight: Inductive Bias in Social Geometry
What makes this work significant is its Inductive Bias: the assumption that social influence behaves like physical space. By forcing relationships into a 3D polyhedron, the algorithm naturally clusters highly-connected groups and pushes outliers to the periphery.
Limitations: While elegant for small-to-medium groups, the paper notes that as , the polyhedron approximates a sphere. However, the computational complexity of the correction algorithm for thousands of users remains an open question. Future work likely needs to explore Spherical Embeddings or Manifold Learning to maintain this geometric intuition at scale.
Summary
The "Follow Relationship Model" offers a precise, privacy-preserving alternative to behavioral analysis. By treating social networks as dynamic geometries rather than just data tables, it opens new doors for visualizing human connection in three dimensions.