
Beyond the Flat Graph: Quantifying and Visualizing Social Closeness in 3D
The follow relationship model of social networks: Construction and visualization
This paper introduces a precise mathematical framework for social networks called the Follow Relationship Model. It utilizes a multilayered quantified algorithm to measure user closeness based on public "follow" data and proposes a 3D visualization technique that projects relationship diagrams onto a polyhedron.
TL;DR
Social networks are increasingly complex, yet our tools for viewing them remain largely stuck in 2D. This paper presents a novel Follow Relationship Model that moves beyond vague relationship definitions. By quantifying public "follow" data across multiple layers and projecting the results onto a 3D polyhedron, the authors provide a precise, privacy-conscious way to measure and see social distance.
Context & Positioning
In the landscape of Social Network Analysis (SNA), most researchers rely on content analysis (what users say) or simple graph theory (who follows whom). This paper carves out a niche by focusing on the certainty and transparency of follow relationships. It sits at the intersection of linear algebra and descriptive geometry, providing a bridge between abstract adjacency matrices and human-readable 3D models.
The Problem: The Privacy and Complexity Wall
Existing methods for mapping social ties suffer from two primary issues:
- Privacy Arguments: Many algorithms index post content, which is often private or requires heavy natural language processing.
- The 2D Limit: Tools like Ucinet are excellent for small groups, but as N increases, 2D space becomes cluttered, making it impossible to distinguish between direct and mediated (indirect) influence levels.
Methodology: Layered Matrices and Geometric Projections
1. The Multi-Layered Algorithm
The core innovation is the Multiple Follow Relationship Matrix (). Instead of just looking at whether User A follows User B, the model examines "mediate influence."
The authors define a specific operator :
This is used to calculate higher-order layers, where your relationship strength is boosted if you share mutual connections. This effectively quantifies "The friend of my friend is also my connection."
2. From Closeness to Distance
To visualize this, "closeness" must become "distance." The paper introduces a transformation where the maximum closeness is used as a benchmark, and all other relationships are converted into a Distance Matrix (). Shorter distances in the model represent stronger social bonds.
3. The 3D Polyhedron Visualization
The paper shifts from flat diagrams to a Relationship Polyhedron.
- The Logic: Each user is treated as the center of a 2D diagram.
- The Projection: These diagrams are "enclosed" into a polyhedron. As the number of users increases, the shape matures from a pyramid into a sphere.
- The Correction: Since distances can be redundant or contradictory in 3D space, the authors use a Correction Algorithm (finding the center of a minimal sphere containing normal intersections) to place users in their most "honest" spatial position.
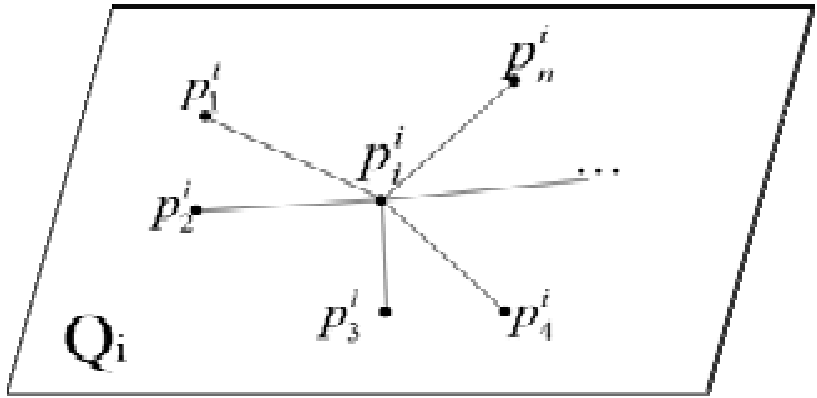 Figure: The process of projecting 2D relationship components into a unified 3D space.
Experiments: A 5-User Test Case
The authors applied the model to a controlled 5-user environment. By setting coefficients for three layers of influence (), they calculated a final distance matrix.
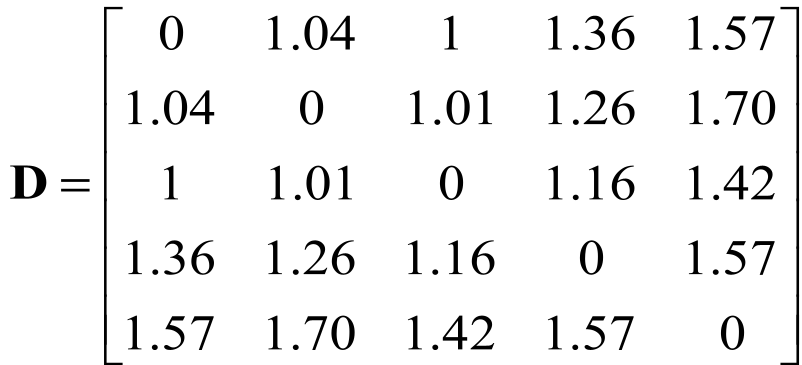 Figure: The final quantified distance matrix used for spatial mapping.
The visualization output (Fig 5) shows the users distributed within a pyramid, clearly marking User 1 and User 3 as "closer" in the social fabric compared to more isolated nodes.
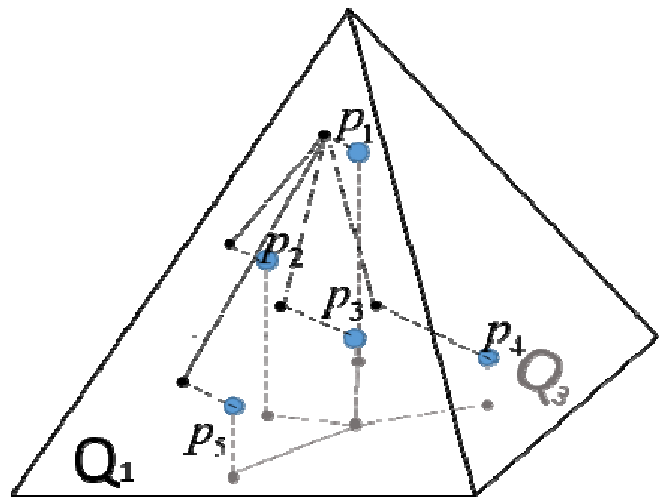 Figure: The resulting 3D placement of users based on follow-relationship distances.
Critical Insight & Analysis
Why this works: By using follow data, the model is remarkably robust against "noise" found in text-based sentiment analysis. The matrix structure ensures that adding more users doesn't exponentially increase the complexity of the calculation, only the size of the storage.
Limitations:
- Scalability of the Polyhedron: While the math holds, visualizing 10,000 users inside a 3D sphere might lead to a "cloud" of points where internal nodes are hard to see without interactive transparency tools.
- Uniform Weights: The current model assumes a follow is a follow. In reality, a follow from an "influencer" might carry more weight than one from a "bot," a factor that could be integrated into the coefficient set in future iterations.
Conclusion
The Follow Relationship Model successfully transforms abstract social ties into a tangible, geometric reality. By moving to 3D and focusing on verifiable "follow" actions, it offers a scalable and mathematically rigorous path forward for social network mapping.