
Nasza-klasa.pl: Why Traditional Graph Theory Fails Huge Social Portals
Analysis of Social Network’s Structural Properties in Huge Community Portal
This paper investigates the structural properties of nasza-klasa.pl, a massive Polish social network with 7.5 million users. The authors propose a hypergraph-based affiliation network model to better represent the implicit group structures (schools and classes) that traditional graph-based analysis fails to capture accurately.
Executive Summary
TL;DR: Analyzing massive social networks isn't just a matter of scale; it's a matter of structure. This paper demonstrates that for portals like nasza-klasa.pl (a Polish Facebook equivalent), traditional graph analysis becomes distorted by "clique-heavy" structures. By re-imaging the network as a Hypergraph—where nodes are classes and edges are people—we can unlock deeper insights into how social connections actually evolve.
Academic Context: This work serves as a critical methodology shift, moving from "Person-to-Person" graph modeling to "Entity-based" Affiliation Networks to handle massive datasets where crawling is virtually impossible.
The Problem: The "Clique" Distortion
Most social networks are analyzed as simple graphs (Nodes = People, Edges = Friendship). However, nasza-klasa.pl is built around local school classes. This creates a unique problem:
- Hyper-density: Within a class, almost everyone is connected, creating a "clique" (complete subgraph).
- Centrality Noise: Standard metrics like Betweenness Centrality (which identifies "bridge" nodes) return near-zero values for most users but abnormally high values for the few users connecting two classes.
- False Signals: Clustering coefficients in these networks are near 1.0, which is functionally useless for distinguishing different social behaviors.
Methodology: Shifting to Hypergraphs
To solve this, the authors propose a Hypergraph/Affiliation Network model.
1. The Standard Graph Approach (Fig 1 & 2)
Initially, the authors visualized a single school. As seen in the architecture below, the center is so densely connected it becomes a visual and mathematical "blob."
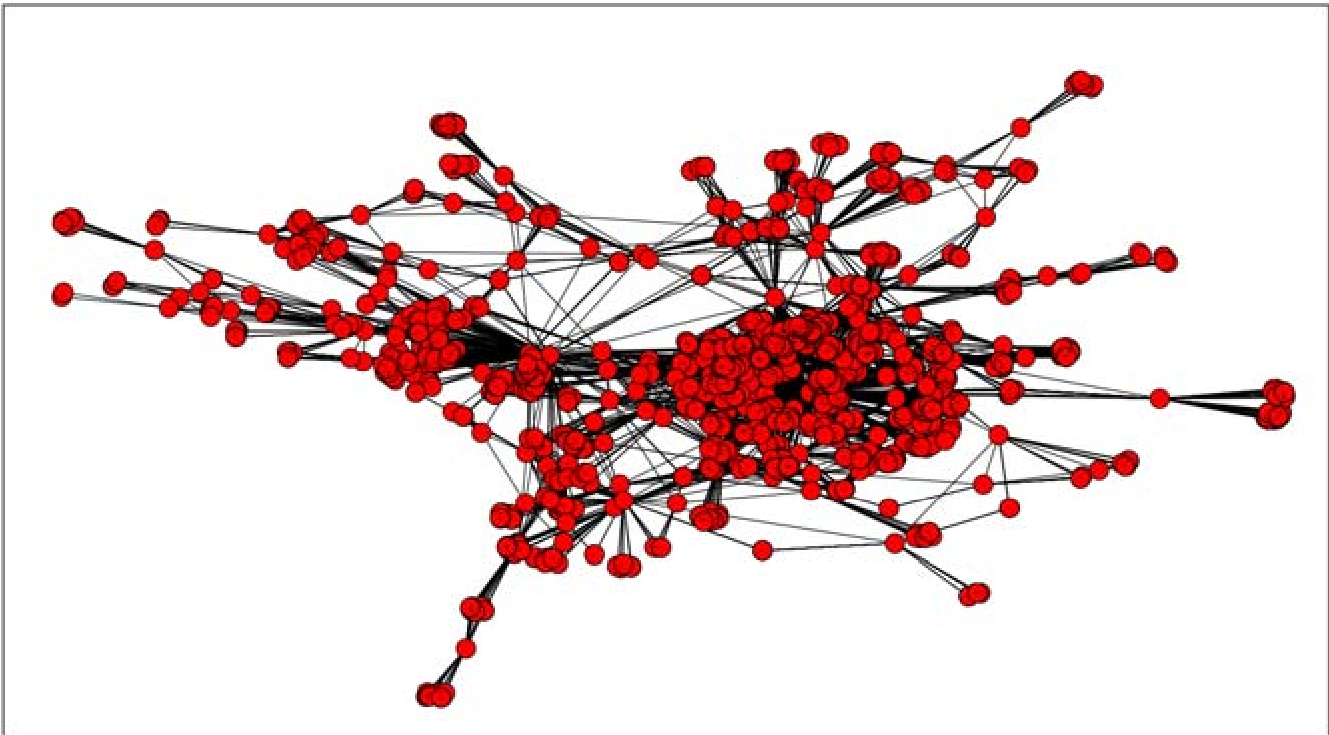 Fig. 2: A zoom on the connected part of a single school, showing the limitations of node-link visualization.
2. The Affiliation Pivot
Instead of users being nodes, the researchers turned School Classes into the primary nodes.
- Nodes: A specific class (e.g., Grade 5A, Class of '98).
- Edges: A person who belongs to more than one group (e.g., a user who is in a "Primary School" class and a "High School" class).
This creates a hypergraph where a single "edge" (the person) can connect multiple nodes (their different lifetime education groups).
Experiments and Results: Faster Dynamics
The authors tracked the network over three months (June to September). The results showed a fascinating discrepancy in growth rates:
| Metric | Standard Graph Growth | Hypergraph Growth |
|---|---|---|
| Nodes | 4.5% | -0.8% (Stable) |
| Edges/Connections | 8.1% | 23% |
This suggests that while the population of the portal was stabilizing, the inter-connectedness between existing groups was exploding. The hypergraph model captured this "educational path" movement much more clearly than the standard person-to-person graph.
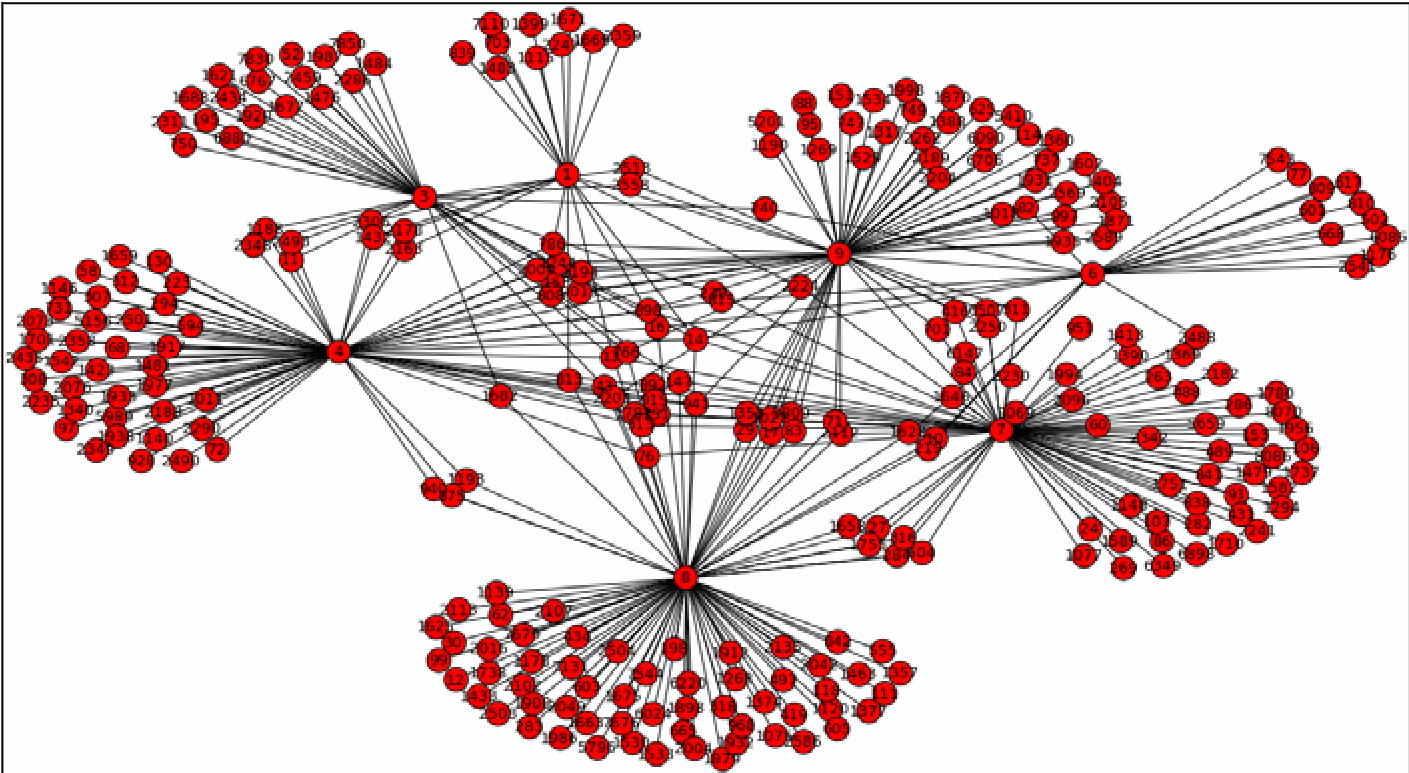 Fig. 5: Representation of schools network showing tree-like patterns of students moving from high schools to universities.
Critical Analysis & Conclusion
Takeaway: The study proves that in networks with "Implicit Structures" (like organizations, schools, or offices), local node connectivity measures are misleading. The Affiliation Network model using hypergraphs is far more robust for analyzing large-scale dynamics and sociological trends.
Limitations:
- The data was a partial sample (0.5-1%). While representative of local topology, global dynamics might differ.
- The study focuses on "weak links" (mere affiliation) rather than "strong links" (active communication).
Future Outlook: This approach opens the door for Educational Path Mining. Universities could use this hypergraph data to see which high schools act as "feeder" nodes for specific departments, allowing for highly targeted recruitment and sociological research into social mobility.