
Deciphering the Core-Satellite Pulse: Visualizing Social Dynamics in Regional Networks
Social process visualization in regional community network users
The paper introduces VENUS (Visualization of Electronic Network User Social processes), a tool designed to analyze long-term information sharing in regional community networks. It proposes the "Spiral Visualization" algorithm to map "core-satellite" structures in social networks, specifically targeting naive home users in field trials.
TL;DR
This research addresses the difficulty of monitoring how "naive" home users form social structures in regional networks. By introducing VENUS and the Spiral Visualization method, the author provides a way to identify influential "core" users and their "satellite" followers, revealing how community networks evolve, stabilize, or fracture over long periods.
Context: Beyond the Office Cubicle
Most social network analysis (SNA) was born in corporate or academic environments where roles are defined and communication is task-oriented. However, in "regional community networks" (like the Hayashi NTT-Company House trial), user behavior is driven by informal relationships and vague motivations.
The author points out that home users are "naive"—their digital habits are easily replaced by face-to-face talk, making their online presence fragile. To understand these users, we need more than a static graph; we need an exploratory tool that allows researchers to "tune" the visualization to find hidden structures.
Methodology: The Spiral Visualization Algorithm
The core innovation is the Spiral Visualization method. Unlike general force-directed graphs that treat all nodes equally, this method assumes a social hierarchy:
- Core Identification: Nodes exceeding a specific message flow threshold (e.g., >10 messages) are labeled as "Core."
- Satellite Mapping: Remaining nodes are "Satellites," linked to parents based on flow strength.
- Spiral Allocation: Core nodes are placed in an inner circle. Satellites are then placed in outer concentric layers (spirals) according to their distance from the core.
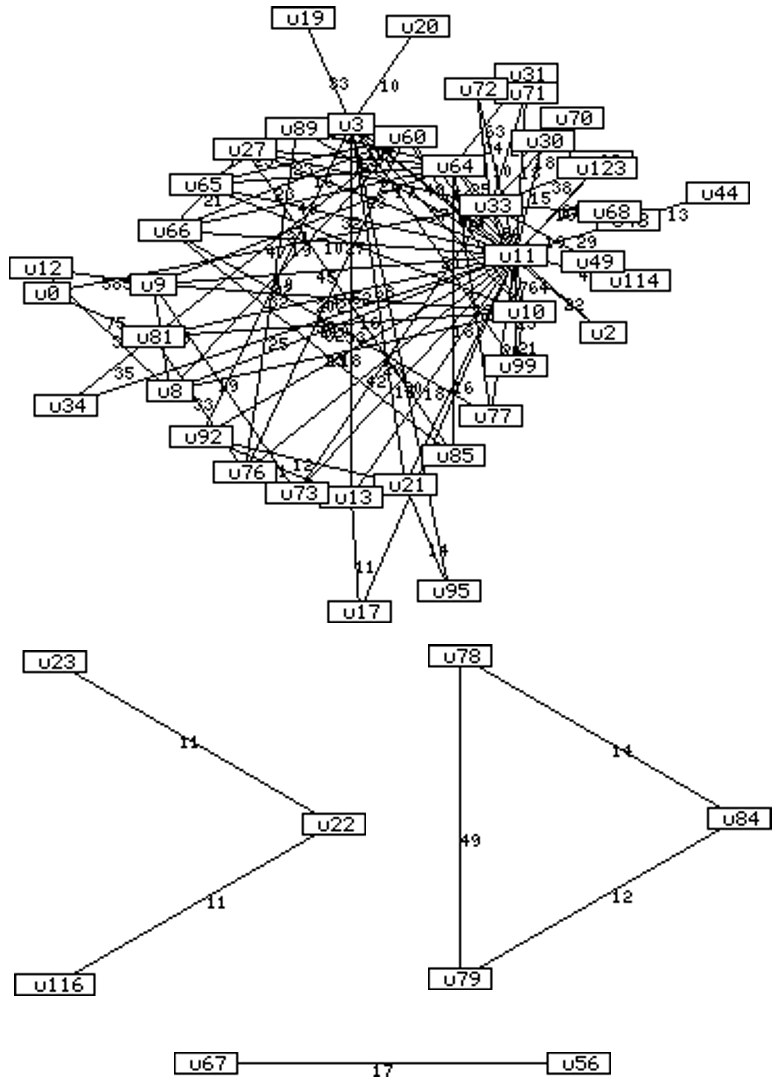 Figure: The data pipeline from raw message logs to a structured core-satellite graph.
Case Study: The Hayashi Trial (1995-1997)
The author tested VENUS on a real-world fiber-optic trial involving 80+ families.
Finding the "Threshold of Persistence"
By adjusting the "Core Threshold," the author discovered that the community's stable core was maintained at a rate of 0.3 to 0.7 messages per week—far lower than office environments, yet sufficient to sustain a social fabric.
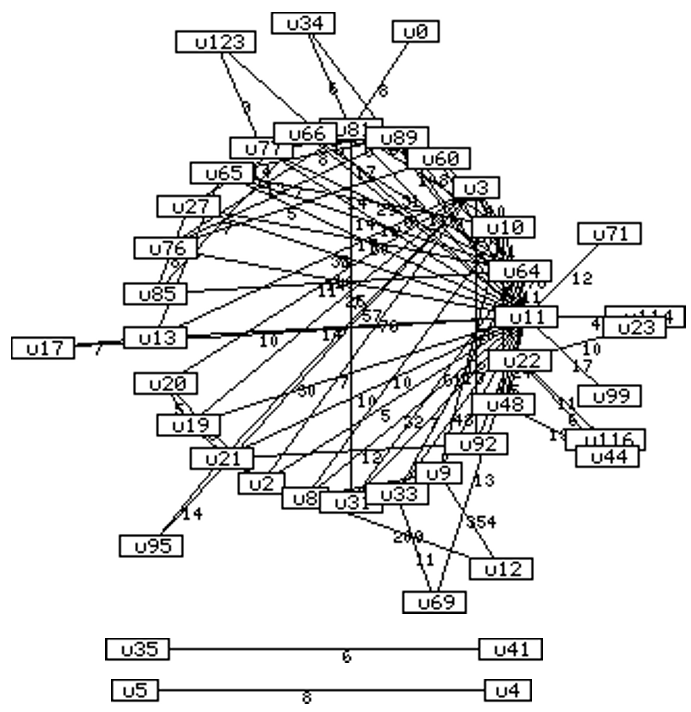 Figure: Using different threshold parameters (20, 7) to filter noise and reveal the "persistent" inner circle of the community.
Detecting Social Turbulance
One of the most striking findings was the visualization of the period between January and October 1997. The graph showed a "radical change" in complexity when 20 new families joined. The previously stable structure became scattered and transient, proving that VENUS could visually "flag" a community in flux before it potentially collapses.
Critical Insight: Why This Matters
The value of this work lies in its Inductive Bias. By assuming a core-satellite structure, the algorithm produces a cleaner, more interpretable map of social "expertise" and "influence" than a generic graph layout.
However, the study is limited by its undirected nature (ignoring who sent vs. who received), which might obscure power dynamics. Furthermore, being a 1990s study, the scale (~126 users) is small by modern standards, but the logic of exploratory parameter tuning remains highly relevant for today's community managers in DAO or Slack environments.
Conclusion
VENUS demonstrates that "culture" in a network can be quantified by its stability and thresholds. For those building regional or niche community tools, the takeaway is clear: don't just provide a platform; provide a way to visualize the "pulse" of the core users who keep the satellites in orbit.