
Navigating the Social Sensing Lineage: A Graph-Based Visualization Approach
A Social Sensor Visualization System for a Platform to Generate and Share Social Sensor Data
This paper presents a social sensor visualization system designed for the platform, which facilitates the generation and sharing of SNS data analysis programs. The core method utilizes graph-based visualization to represent relevances between social sensors based on creation histories and source code/configuration similarity scores.
TL;DR
Creating programs to analyze SNS data (Social Sensors) is often an iterative process where new code builds upon existing templates. This paper introduces a visualization extension for the system that replaces flat lists with a dynamic relevance graph. By combining creation history tracking and structural similarity analysis, the system allows developers to pinpoint the most relevant donor code instantly, reducing search failure rates from 40% to 10%.
Problem: The "List Fatigue" in Code Sharing
In the world of social sensing—where Twitter, Instagram, and Flickr data are mined for real-world insights—reusing existing analysis logic is standard practice. However, the existing (Social Sensor Sharing) platform suffered from a common repository disease: List Fatigue.
When a user searches for a "Keyword Extraction" sensor, they are met with a flat list of metadata. There is no way to see which sensor is a "descendant" of another, or which two programs share 90% of their logic despite different tags. Users spend more time opening files to check their contents than actually writing code.
Methodology: Mapping Relevance Through History and Hashing
The authors propose that "relevance" isn't just about keywords; it's about lineage and structure. Their system defines relevance through two dimensions:
- Creation History (The "Biological" Link): When a user downloads a sensor's source code (SSFD) to use as a template, the system embeds an encrypted ID. When the new sensor is uploaded, the system recognizes the "parent," creating a directed edge in the graph.
- Structural Similarity (The "Genetic" Link):
- For Java Source Code: The system uses Locality Sensitive Hashing (LSH) with 3-grams to calculate similarity. This is fast and robust against minor edits.
- For XML Configs: It calculates the ratio of shared elements/attributes (SSTD and SSOC files).
System Architecture
The visualization engine uses d3.js to render these relationships dynamically.
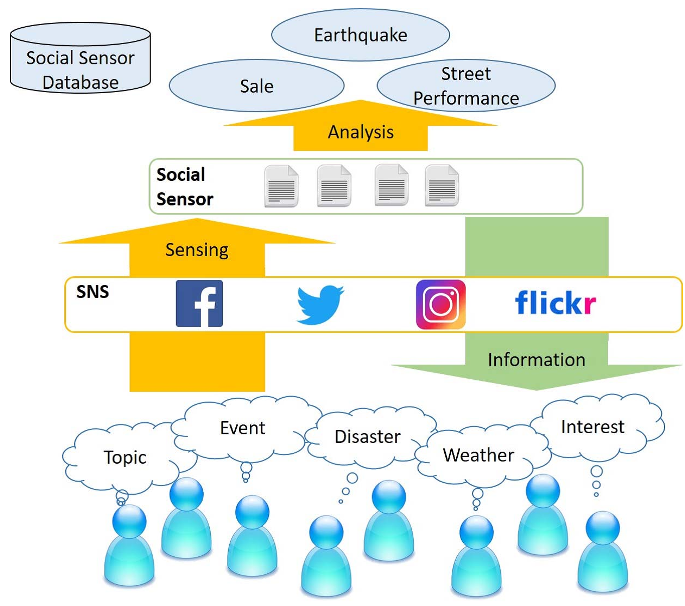
Implementation Features
To prevent the graph from becoming a "hairball" of nodes, the system includes sophisticated filtering:
- Similarity Thresholds: Users can hide edges below a certain percentage (e.g., "only show 40%+ similar").
- Hop Count Limiting: Users can focus on "First-degree relatives" or explore the extended family of a sensor.
- Encrypted Traceability: To prevent "popularity gaming," the creation history files are encrypted to ensure developers don't falsely claim their sensors are highly referenced.
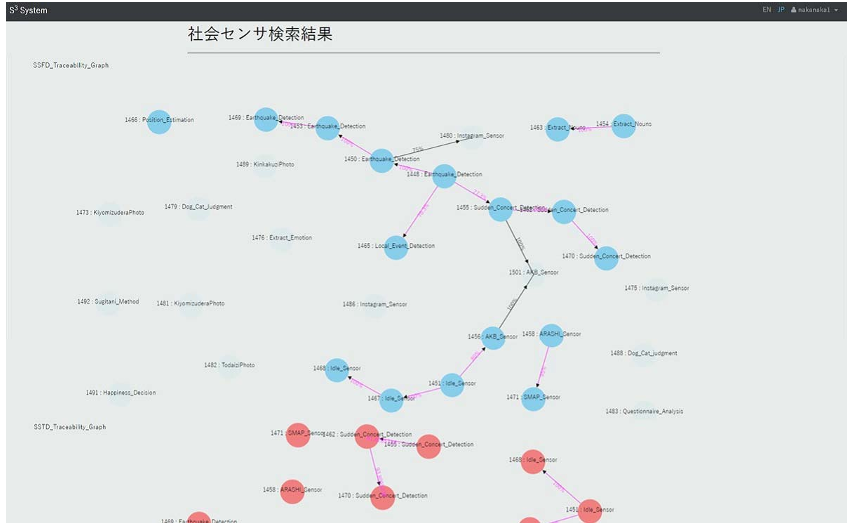
Experiments: Does Visualization Actually Work?
The authors conducted a study with ten subjects comparing the traditional list form against the new graph form.
Quantitative Performance
- Task Success: In identifying the most-referenced social sensors, 40% of users failed using the list form. That failure rate dropped to 10% with the graph form.
- Efficiency: The time required to find the correct reference sensor was consistently lower in the graph interface.
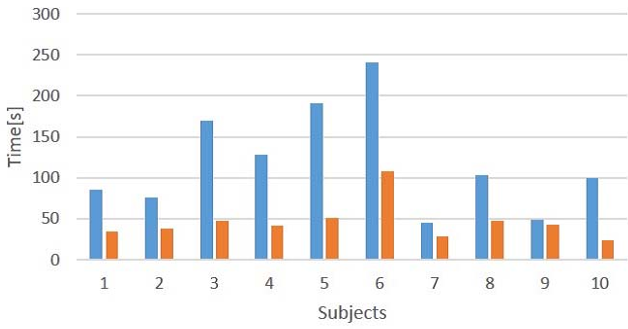
Critical Insight & Conclusion
The true value of this work lies in recognizing that code is an evolving organism. In niche domains like social sensing, code reuse is high. By treating the repository as a pedigree chart rather than a filing cabinet, the system significantly lowers the "cognitive load" for new developers.
Limitations & Future Work
While the LSH approach is excellent for syntax similarity, it may miss semantic similarity (e.g., two different algorithms that perform the exact same task). Future iterations could benefit from Abstract Syntax Tree (AST) analysis or embedding-based similarity (LLM-based) to capture the "intent" of the code beyond just the text strings.
Takeaway: If you are building a collaborative platform, don't just provide a search bar—provide a map.