
The Digital Anatomy of Integration: Mapping Immigrant Social Ties via Big Data
The social ties of immigrant communities in the United States
This study presents a large-scale analysis of immigrant integration in the United States by leveraging de-identified Facebook social network data from over 10 million users. The authors introduce metrics like "compatriot affinity" and "exposure ratio" to quantify social assimilation, revealing significant correlations between digital social ties, spatial clustering, and traditional census-based integration indices.
TL;DR
By analyzing a sample of 10 million Facebook users, researchers from Meta (then Facebook) have provided the first large-scale digital mapping of immigrant integration in the U.S. The study proves that our online "friendship fingerprints" accurately reflect offline assimilation patterns, revealing how cultural affinity, time since migration, and geographic clustering determine how well we blend into a new society.
Context: Why Social Ties Matter
Migration is more than a change of GPS coordinates; it is a fundamental rewiring of a person's social capital. Historically, sociologists have struggled to track this rewiring. While we know that ties to "locals" facilitate job opportunities and language acquisition, and ties to "compatriots" provide emotional support, quantifying this balance at scale was nearly impossible before the era of social graphs.
The authors position this work at the intersection of Sociology and Computational Social Science, shifting the focus from "migration events" (who moved where) to "post-migration outcomes" (how do they live now?).
Methodology: Coding Integration
The study introduces three vital metrics to replace vague sociological concepts:
- Exposure Ratio: The percentage of an immigrant's U.S.-based friends who are "locals" (U.S.-born).
- Compatriot Affinity: The tendency to link with others from the same home country residing in the U.S.
- Co-immigrant Affinity: Friendships formed between different immigrant groups (e.g., a Mexican immigrant befriending a Salvadoran immigrant), which reveals hidden cultural clusters.
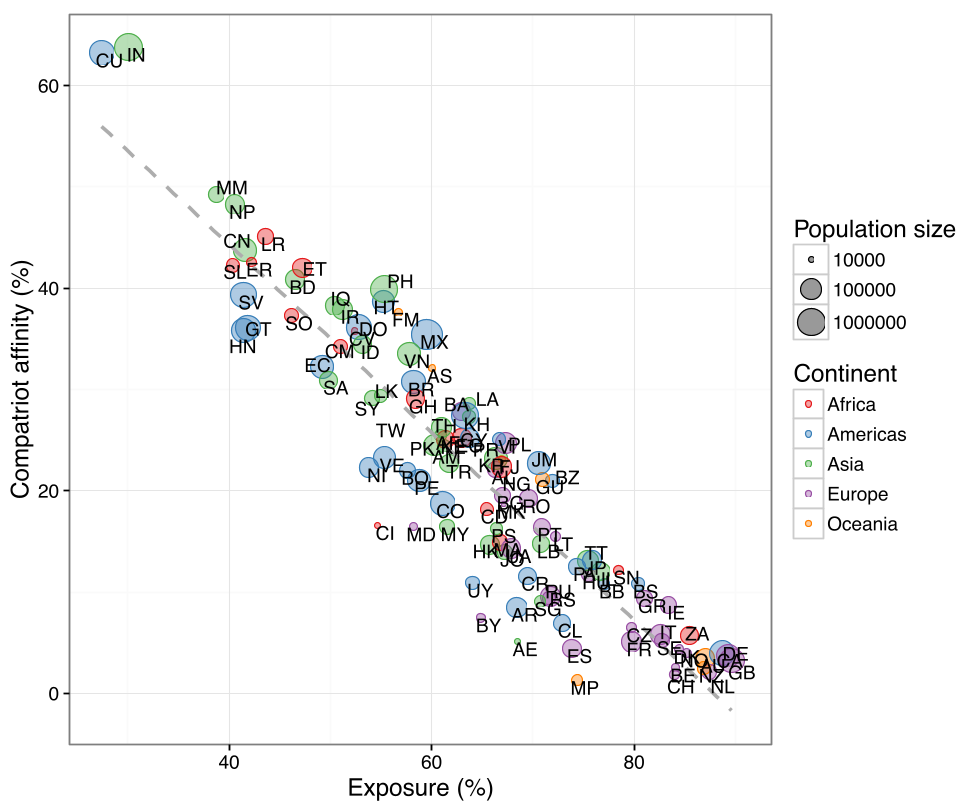 Figure 1: The study's sample aligns closely with U.S. Census data, validating Facebook as a representative proxy for the immigrant population.
Key Insights: The Mechanics of the Melting Pot
1. The Time Factor
Integration is a slow burn. The data shows a massive gap between "old" and "new" immigrant communities. Groups from Germany, Canada, and the UK have exposure ratios exceeding 90%. In contrast, the Indian immigrant community—characterized by more recent arrivals—has a much lower exposure ratio (29%) and a high reliance on compatriot networks.
2. The Spatial-Social Link
There is a significant negative correlation (ρ = -0.42) between spatial clustering and social integration. Groups that live in hyper-concentrated neighborhoods (like Cuban immigrants in specific Florida enclaves) maintain high compatriot affinity regardless of how long they have lived in the U.S.
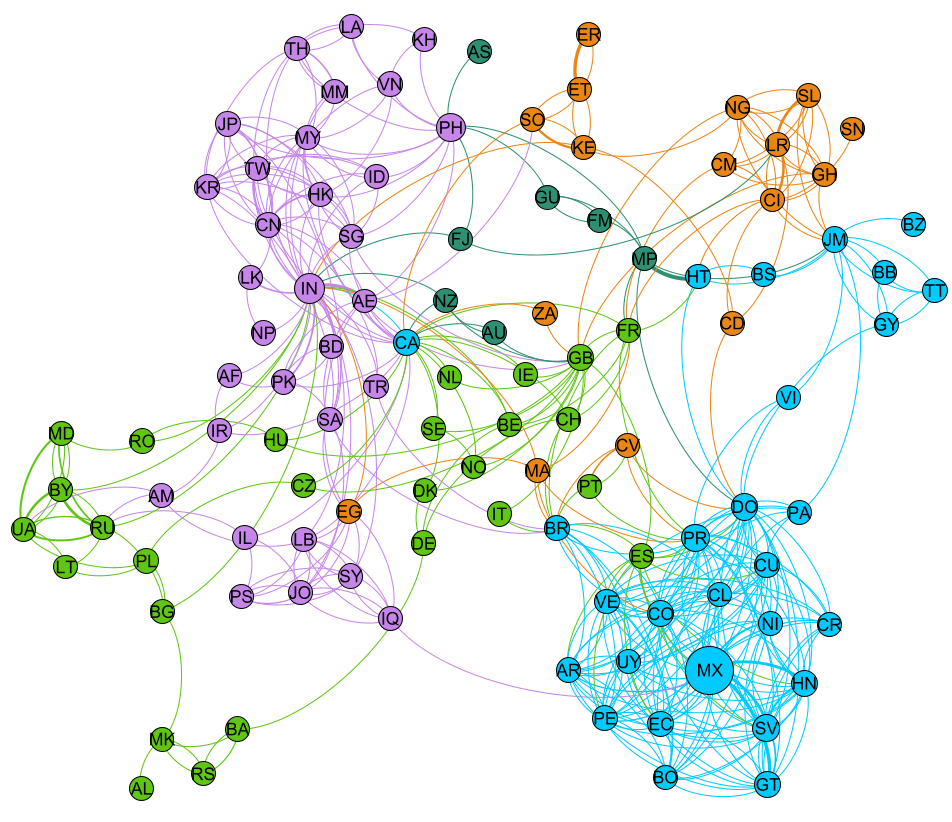 Figure 5: A clear inverse relationship—as an immigrant group’s "compatriot affinity" (in-group ties) increases, their objective Composite Assimilation Index (CAI) scores drop.
3. Cultural "Civilizations" in Networks
By mapping co-immigrant affinity, the authors discovered that immigrants don't just stay in their silos; they form "super-clusters" based on cultural and linguistic proximity. This digital map mirrors Samuel Huntington’s "clash of civilizations" theory, showing strong ties between Latin American groups, or between Middle Eastern and South Asian communities, independent of their ties to the "American mainstream."
Critical Analysis & Future Outlook
While the paper is a landmark in structural assimilation research, it does have limitations:
- Self-Selection Bias: The data only includes those who choose to list their "hometown" on Facebook—a behavior that might itself be linked to a person’s pride in their origin or desire to assimilate.
- Tie Strength: The study treats all "friends" as equal, ignoring the difference between a close life-long confidant and a casual acquaintance.
The Takeaway: This research proves that "Digital Integration" is a mirror of "Physical Integration." For policy makers and urban planners, it suggests that fostering diverse residential neighborhoods is the most effective lever for breaking social silos and accelerating the incorporation of new arrivals into the national fabric.
Conclusion
As we move into an era of increasingly digital lives, the social graphs we build on platforms like Meta afford us a more precise, real-time understanding of the "Great American Melting Pot" than any census ever could.