
Social TV and the Social Soundtrack: Decoding the Second Screen Phenomenon
Social TV and the Social Soundtrack: Significance of Second Screen Interaction during Television Viewing
This research investigates the "Second Screen" phenomenon, specifically how social media (Twitter) acts as a "Social Soundtrack" during TV viewing. By analyzing 418,000 tweets across three popular shows, the study demonstrates that live broadcasts trigger significantly higher social interaction and mobile device usage compared to non-live periods.
TL;DR
This study explores the "Social Soundtrack"—the digital conversation surrounding television content. By analyzing over 418,000 tweets, researchers confirmed that live TV triggers a massive surge in social media interaction, particularly on mobile devices. Interestingly, while mobile usage spikes, desktop computers remain a formidable "second screen," proving that the social TV experience is multi-platform by nature.
Context: This work provides empirical grounding for the shift from passive TV consumption to active, multi-screen engagement, positioning it as a foundational study for personalized advertising and social commerce.
Problem & Motivation: The Death of Passive Viewing
Television is no longer a "lean-back" medium. The rise of smartphones has introduced the Second Screen—a secondary device used to augment the primary viewing experience.
While previous research focused on niche prototypes (like AmigoTV) or specific sports sentiments, there was a lack of rigorous statistical evidence on when and how general audiences interact across different genres. The authors sought to understand the "Social Soundtrack": the real-time social commentary that embeds itself into modern TV culture. The core question: Does "Live" status fundamentally change human information-sharing behavior?
Methodology: High-Volume Social Analytics
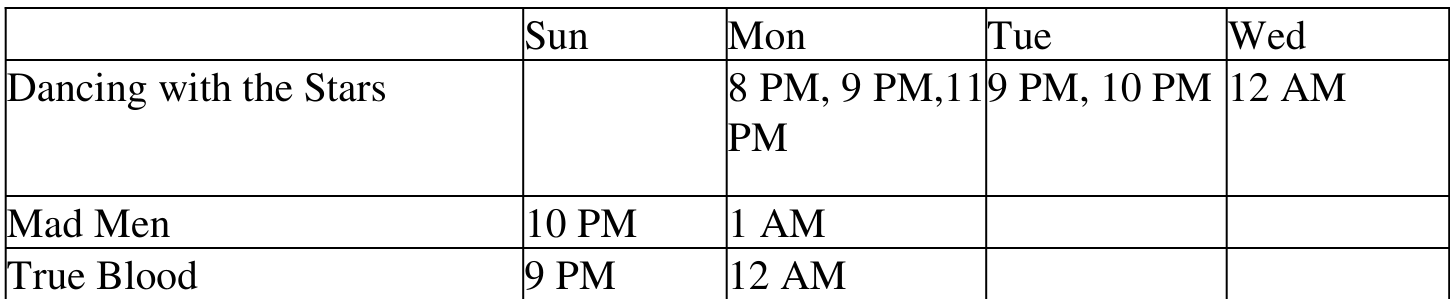
The researchers tracked three major shows representing different genres to ensure generalizability:
- Reality: Dancing with the Stars
- Period Drama: Mad Men
- Fantasy Drama: True Blood
The Classification Engine
To distinguish between mobile and non-mobile users, the team parsed the "Source" field from Twitter's JSON API. Keywords like "iPhone," "Android," and "Mobile Web" were used to tag mobile interactions.
Statistical Rigor
Because social media data is often non-normal (heavy-tailed), the authors applied a Box-Cox transformation (specifically a log transform) to normalize the data before running two-tailed t-tests at a 95% confidence interval.
Experiments & Results: The "Live" Effect
The findings validated the research hypotheses with high statistical significance:
1. The Power of Live Broadcasts
The volume of tweets during live telecasts (rtSS) was significantly higher than during off-air times (nrtSS). This confirms that live TV acts as a synchronization point for mass social behavior.

2. The Mobility Surge
Mobile devices showed a dramatic increase in usage during live windows. The "always-on" nature of smartphones makes them the natural companion for the tactile, rapid-fire nature of live Tweeting.
3. The Desktop Paradox
Surprisingly, in a head-to-head comparison between mobile and desktop devices during live shows, the study found no significant difference (see Table 4). This suggests that many viewers may be using laptops or desktops to watch and chat simultaneously, or they prefer the "heavyweight" interface for long-form social interaction.

Critical Analysis & Conclusion
Key Takeaways
- Synchronization is King: For advertisers, the "reach" of a TV ad is amplified by the simultaneous social conversation.
- Genre Agnostic: The behavior held true across reality TV and scripted dramas, suggesting a fundamental shift in how humans process televised information.
Limitations & Future Work
The study primarily focuses on quantitative volume (tweet counts) rather than qualitative content (what is being said). Furthermore, as the data is from 2013, the landscape has evolved specifically with the rise of "Threads," "Discord," and "TikTok" as tertiary screens.
Future research must address "Content Analysis" of the social soundtrack—determining if the conversation is about the plot, the actors, or the advertisements themselves—to fully unlock the commercial potential of the second screen.
Final Thought: The "Social Soundtrack" has turned the solitary living room into a global, interconnected stadium. Understanding the pulse of this soundtrack is the next frontier for media analytics.