
Dialing into Wealth: How Your Mobile Footprint Maps New Socio-Economic Realities
On the relationship between socio-economic factors and cell phone usage
This paper presents a large-scale computational study titled "On The Relationship Between Socio-Economic Factors and Cell Phone Usage," which analyzes the link between mobile behaviors and social metrics in a Latin American emerging economy. Using Call Detail Records (CDRs) from 10 million users and national census data, the authors demonstrate that mobile consumption, social network structures, and mobility patterns are strong indicators of socio-economic status (SES).
TL;DR
Researchers from Telefonica have pioneered a method to map an entire country’s socio-economic landscape by analyzing 10 million mobile users' digital footprints. By blending Call Detail Records (CDRs) with official census data, they achieved an impressive 82% accuracy (R² ≈ 0.82) in predicting a region's wealth and education levels. The verdict? How far you travel and who calls you back are profound signals of your economic status.
Background Positioning
In the context of 2012's burgeoning "Big Data for Development" (BD4D) movement, this paper transitioned social sensing from small-scale surveys to national-level analytics. It stands as a seminal work in Computational Social Science, proving that telecommunications metadata is not just "noise"—it is a high-fidelity proxy for human development.
The Core Motivation: The High Cost of Knowing
In emerging economies, knowing "who needs what" is a billion-dollar problem. National Statistical Institutes (NSIs) spend years and millions of dollars conducting household surveys that are often obsolete the moment they are printed.
The authors' insight was simple yet powerful: Cell phones are ubiquitous even where infrastructure is not. If we can find the "fingerprint" of a high-income vs. low-income user in their calling patterns, we can create a real-time, low-cost "soft census."
Methodology: Bridging Digital and Physical Maps
The technical challenge lies in the "matching problem." Census data is organized by administrative blocks (Geographical Units), while mobile data is organized by cellular towers (BTS).
1. Spatial Fusion
To align these worlds, the team used Voronoi Diagrams to estimate the coverage area of each tower. They then applied a scan-line algorithm to merge these coverage polygons with census maps, allowing them to calculate weighted socio-economic averages for every cellular tower.
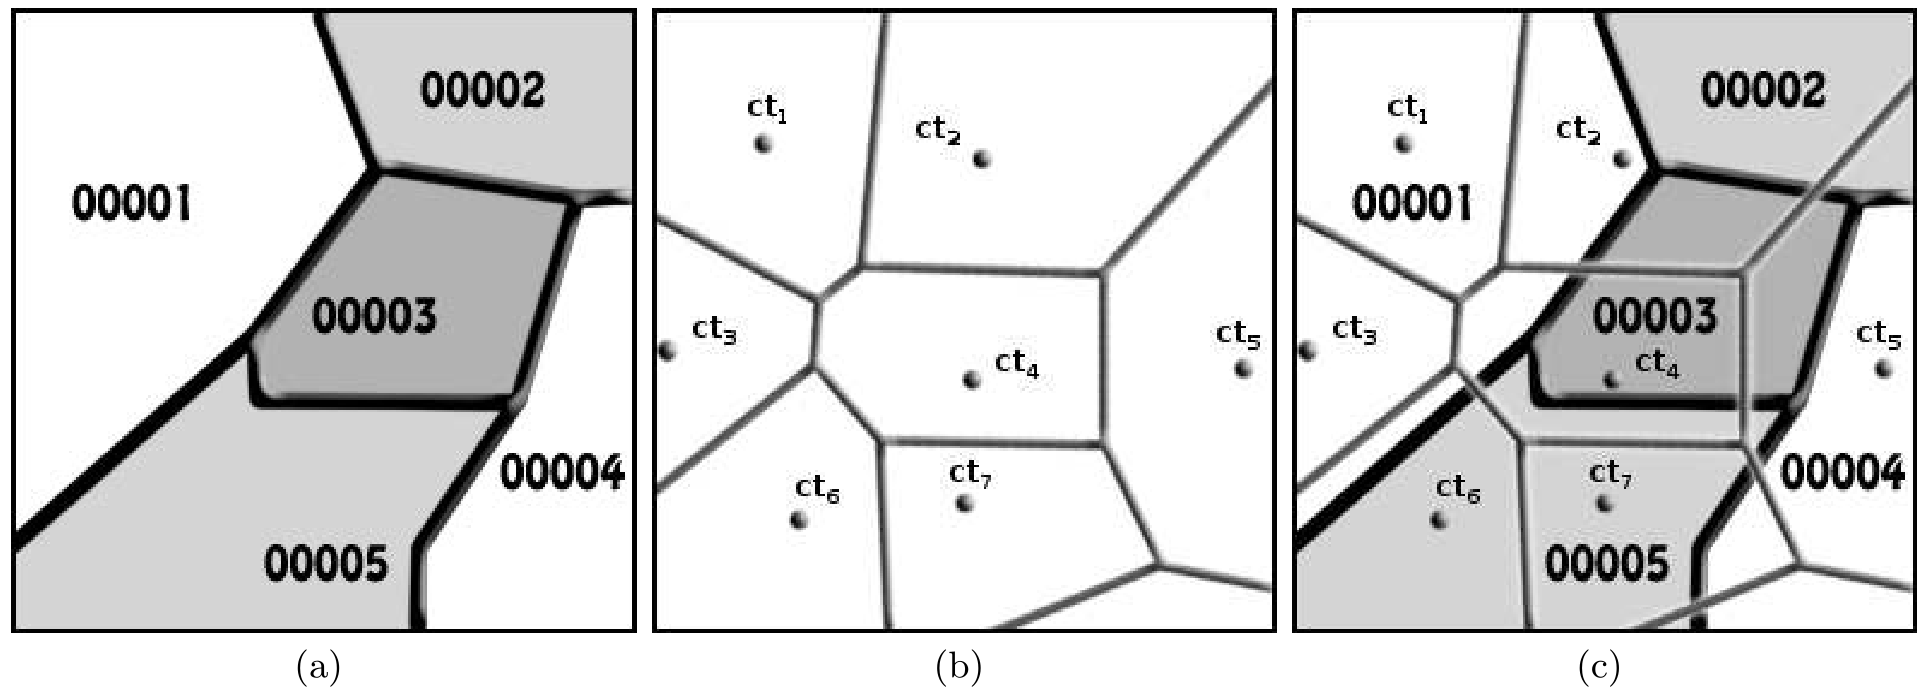 Figure 1: The three-step mapping process—(a) Census GUs, (b) BTS Voronoi areas, and (c) the final overlapped analytical map.
2. Feature Engineering
They didn't just look at total calls. They categorized features into:
- Consumption: Expenses and SMS volume.
- Social: Reciprocity (do people call you back?) and the physical distance between you and your contacts.
- Mobility: Radius of Gyration (the typical distance between your home and work) and the number of unique towers visited.
Critical Insights: What Does Wealth Look Like in Data?
The results revealed fascinating behavioral signatures of socio-economic levels (SEL):
- The Mobility Dividend: Wealthier individuals have significantly higher mobility. They visit more unique locations and have a larger "Radius of Gyration."
- Social Span: Higher education levels (secondary school and above) correlate with a social network that is geographically more extended. Poorer social groups tend to have more "localized" communication circles.
- Reciprocity: There is a moderate positive correlation between SES and the number of reciprocal communications. Essentially, reciprocal social ties are denser in higher-income brackets.
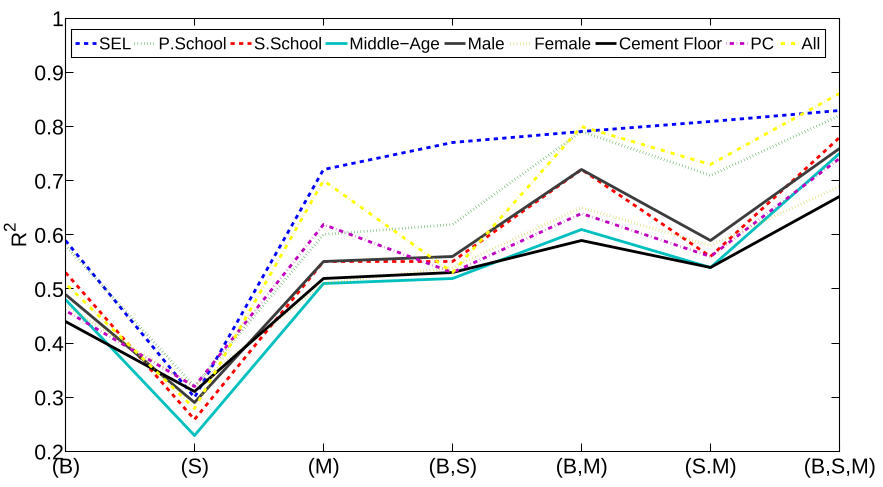 Figure 2: Multivariate Regression performance showing that mobility (M) and behavioral (B) features are the strongest predictors of census variables.
Critical Analysis & Conclusion
Takeaway
The study's ability to approximate the Socio-Economic Level (SEL) with an R² of 0.83 suggests that mobile carriers sit on a goldmine of data for public good. This approach can identify "behavioral niches," helping tailor services in health, education, and banking to those who need them most.
Limitations
- Urban Bias: The sample was drawn from 12 large/middle-sized cities. Relationships in rural areas—where cell towers are sparse—might vary significantly.
- The "Father" Effect: As noted in Figure 2 of the paper, subscriber data often skews male because the "household head" typically signs the contract, even if the user is a child or spouse.
Future Outlook
This work paved the way for modern "Data for Good" initiatives. In a world of increasing privacy regulations (like GDPR), the challenge for the next decade is: How do we extract these vital socio-economic insights while maintaining the absolute anonymity of the citizens? This paper remains the foundational proof that the "What" and "Where" of our digital lives can explain the "Who" of our social reality.