
Mapping the Social Fabric: Using Sociogram Analysis to Uncover Group Dynamics in Online Forums
A Sociogram Analysis on Group Interaction in an Online Discussion Forum
This paper utilizes Sociogram Analysis to map group interactions within an online discussion forum (WebCL) for 23 undergraduate students. By visualizing communication patterns across two distinct tasks, the study identifies key roles such as "active leaders" and "isolated participants," demonstrating that targeted pedagogical intervention can significantly improve group social network density and interaction balance.
TL;DR
Online discussion forums are often "black boxes" of student interaction. This study uses Sociogram Analysis to visualize the flow of communication among students in a course. By comparing two consecutive tasks, the research proves that monitoring social networks can help instructors transform a fragmented group of individuals into a cohesive learning community, shifting focus from merely "completing a task" to "learning from one another."
The "Black Box" of Online Discussion
While online learning environments like WebCL provide the infrastructure for collaboration, they do not automatically foster it. The core problem highlighted by Zhao is that students—particularly those from traditional "teacher-centered" backgrounds—often treat group tasks as individual assignments done in proximity to others.
The author argues that without a visual tool to map these interactions, instructors cannot see who is dominating the conversation, who is being ignored, and whether the students are actually talking to each other or just shouting into the "task void."
Methodology: The Sociogram as a Diagnostic Tool
A sociogram is a schematic rendering of communication patterns. In this study, the author defines a specific structure:
- Nodes: Representing students.
- The Centre: Representing the "Group Task."
- Directed Edges: Arrows showing who sent a message to whom.
- Weights: Numbers indicating the frequency of messages.
This allows us to distinguish between Task-Centric Interaction (sending work to the forum) and Interpersonal Interaction (responding to and building upon peers' ideas).
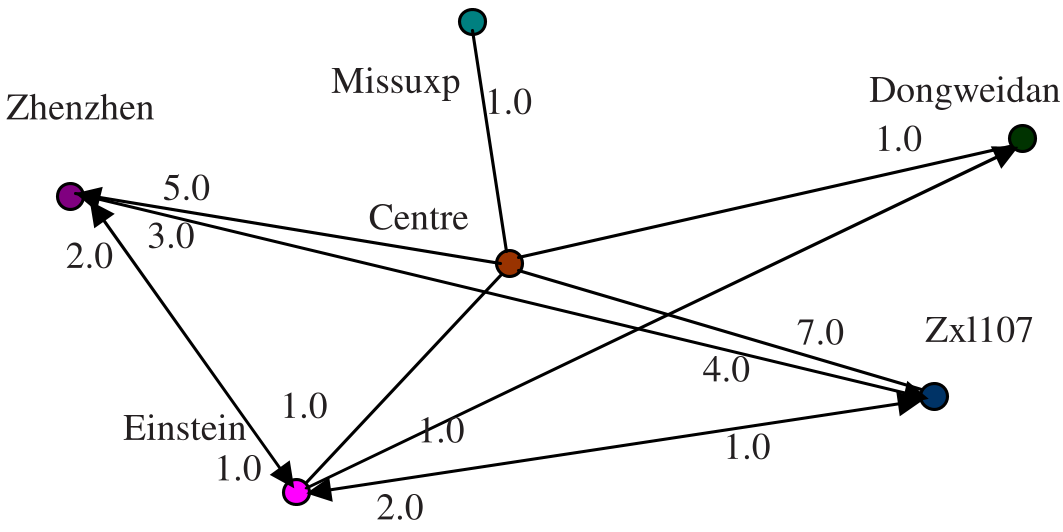 Figure 1: A typical Sociogram from the study showing uneven participation in Task 1.
Visualizing Progress: From Task 1 to Task 2
The most compelling aspect of this research is the evolution of the groups. In Task 1, several groups exhibited "isolated" members (nil contribution) and a high percentage of messages directed solely at the center.
Key Transitions observed:
- Increased Frequency: Across almost all groups, the volume of messages grew.
- Decreased Centralization: The percentage of messages directed at the "task centre" dropped. In Group 5, this was a dramatic shift from 87.5% task-centric to 45.8% peer-centric.
- Balanced Participation: The "Three Active Students" rule (where a small minority does 90% of the work) began to fluctuate as instructors provided support to less active participants.
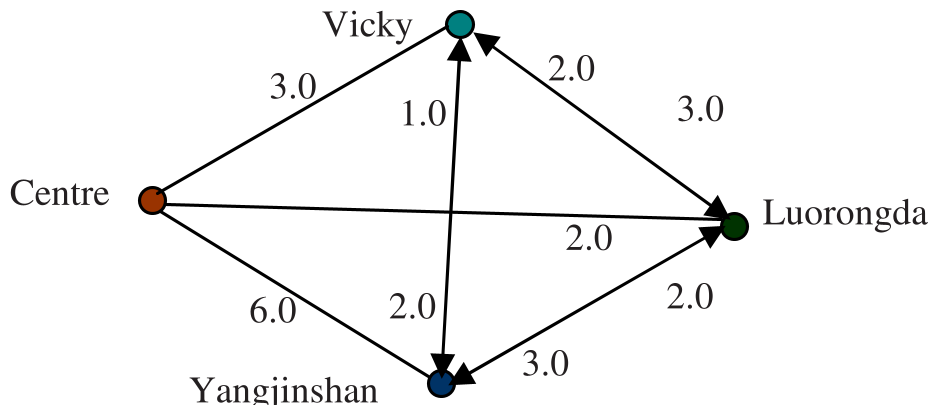 Figure 2: The idealized interaction in Group 5 during Task 2, where every member finally communicates with one another.
Expert Insights: Why This Matters
The study provides a critical "reality check" for Computer-Supported Collaborative Learning (CSCL).
- The Dominance Risk: The sociograms revealed that very active students can sometimes "damage other students' enthusiasm" by dominating the space.
- The "Silent" Student: Isolated students (those with 0-1 messages) were identified as a priority for intervention. The author suggests email and face-to-face meetings as "scaffolding" to bring them back into the fold.
- Structural Limits: The paper honestly notes a limitation: while a sociogram shows how much students talk, it doesn't show what they are saying.
Conclusion: Beyond Lines and Arrows
The value of this work lies in its call for active moderation. We cannot assume students know how to cooperate in a digital space. By using sociograms, teachers can move beyond anecdotal evidence and gain a "birds-eye view" of the social health of their classroom.
For future research, the next frontier is combining this structural visualization with Natural Language Processing (NLP) to automatically categorize the quality of the interactions represented by these arrows.
Keywords: Sociogram Analysis, Online Learning, Group Interaction, Social Network Analysis, WebCL.