
Beyond Geography: Building Resilient Environmental Monitoring with Soft Sensor Networks
Soft Sensor Network for Environmental Monitoring
The paper introduces a "Soft Sensor Network" (SSN) for environmental monitoring, specifically focusing on rainfall detection in Tuscany, Italy. By leveraging multivariate regression and machine learning on historical data, the authors create a virtual measurement layer that can backup or validate hardware sensors (WSN), achieving a high correlation (CC = 0.9249) between predicted and actual rainfall.
TL;DR
Environmental monitoring stations often face downtime or data corruption. This paper presents a Soft Sensor Network (SSN)—a virtual software layer that mimics physical hardware (pluviometers). By utilizing multivariate regression over historical series and prioritizing correlation-based clusters over simple geography, the system serves as a robust backup and validation tool, providing accurate data even when physical sensors fail.
The Fragility of Hardware in the Wild
Large-scale environmental monitoring (WSN) is essential for flood prevention and climate study. However, hardware is fallible:
- Station Failures: Maintenance issues can lead to "Not a Number" (NaN) data for days or months.
- Scale Limitation: Many phenomena are local (e.g., cloudbursts); a station-wide threshold might trigger too many false positives.
- The Geographic Trap: Most researchers assume that the nearest sensor is the best predictor. This paper challenges that assumption, proving that regional topography and weather patterns often link distant sensors more strongly than immediate neighbors.
Methodology: The Virtual Measure Layer
The authors propose an architecture where every hardware sensor has a corresponding Soft Sensor twin.
1. Optimal Clustering Theory
The core of the methodology is the selection of the "input set." Instead of just looking at a map, the authors compute two 160x160 matrices:
- Correlation Matrix: Measuring how closely two stations' outputs track each other over 15 years.
- Distance Matrix: Measuring physical Euclidean distance.
The model then uses Multivariate Regression (Equation 1) to predict the output of station :
2. Architecture Comparison
The study highlights that "functional relations" are deeper than "spatial relations."
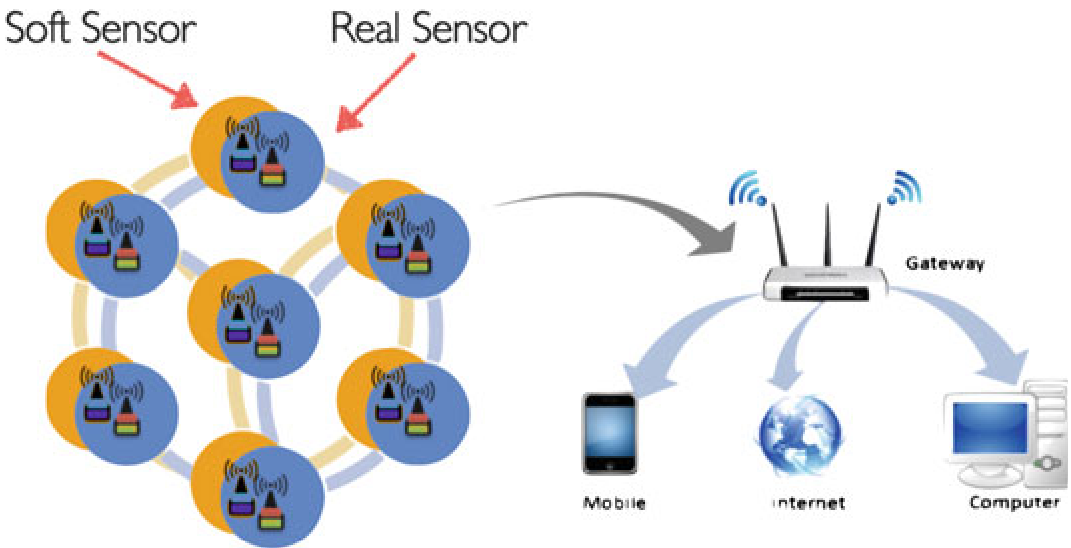 Figure 1: The mapping between the physical WSN layer and the virtual SSN layer.
Experimental Insights: Correlation vs. Distance
Using data from 279 pluviometers in Tuscany (refined to 160 reliable ones), the authors tested cluster sizes from 1 to 159.
Key Finding: Efficiency of Correlation
The researchers found that correlation-based clusters achieve lower error rates with smaller cluster sizes. This means a soft sensor only needs data from a few highly-correlated "peers" to reach peak accuracy, whereas distance-based models require many more sensors to compensate for the "noise" of geographically close but meteorologically different stations.
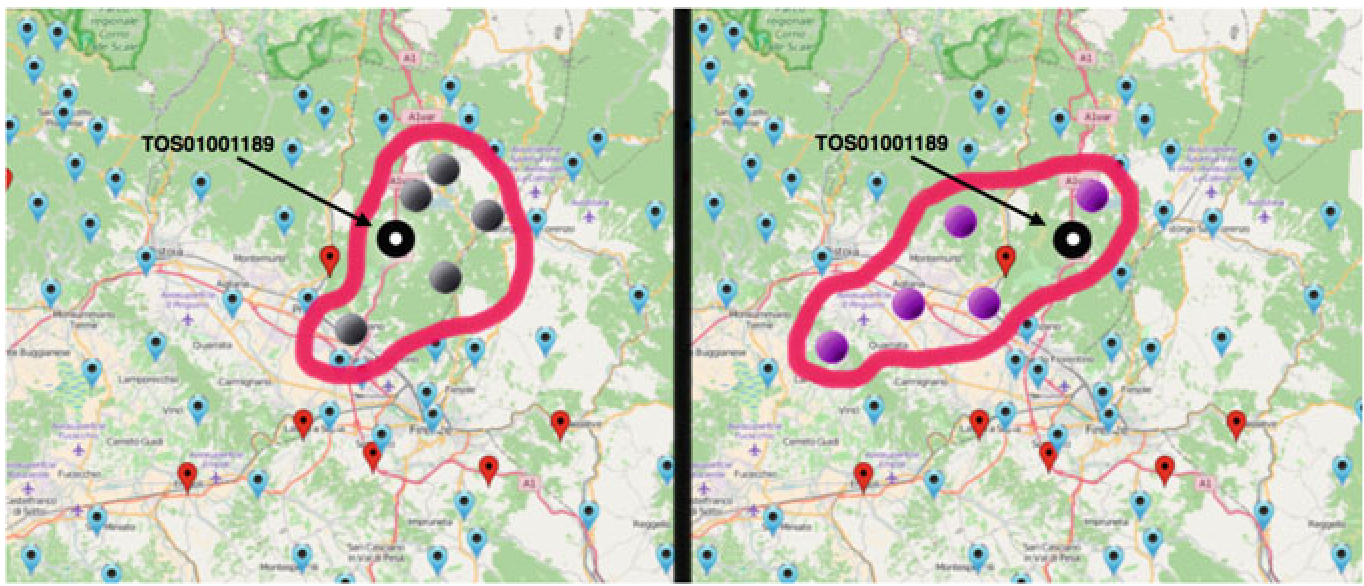 Figure 2: Performance analysis showing that correlation-based clusters (lower curves) consistently yield smaller errors than distance-based metrics.
Performance Metrics
As shown in the table below, the soft sensor based on correlation () outperformed both the distance-based sensor () and the baseline "null" sensor across all metrics, including the Correlation Coefficient (0.9249) and standard deviation of error (2.8479).
| Evaluator | Soft Sensor (Correlation) | Soft Sensor (Distance) | Null Sensor |
|---|---|---|---|
| Std Dev | 2.8479 | 3.2831 | 3.3366 |
| Corr Coeff (CC) | 0.9249 | 0.9005 | 0.8998 |
Critical Analysis & Conclusion
The strength of this work lies in its pragmatic simplicity. While many modern approaches might jump to complex Deep Learning, the authors prove that a well-tuned multivariate regression based on a smart "statistical geography" provides a highly interpretable and efficient solution.
Takeaways for Industry:
- Redundancy: Soft sensors are a "free" way to provide N+1 redundancy to high-cost hardware deployments.
- Validation: By comparing real-time hard data with soft sensor predictions, operators can automatically flag malfunctioning hardware that is producing "legal but incorrect" values.
- Beyond Tobler's Law: When designing sensor networks, data science teams must look beyond physical proximity and analyze the latent functional correlations in historical data.
Future Work: The authors suggest that this methodology is geographically scalable. One could imagine integrating this with satellite data or more complex machine learning models like Random Forests or Neural Networks to further handle non-linear meteorological surges.