
Celestial Connections: Visualizing Social Strength Through a Solar System Metaphor
The Solar System as a 3D Metaphor to Visualize User Interactions in a Social Network
The paper introduces a 3D visualization framework that maps social network interactions (Facebook) onto a "Solar System" metaphor. It utilizes a weighted linear model to calculate interaction frequencies and visualizes these as orbital mechanics using Unity 3D.
TL;DR
In an era of social media fatigue, understanding our digital relationships is harder than ever. This paper proposes a novel solution: treating your social circle as a 3D Solar System. By mapping Facebook interaction data to physical variables like orbital speed and planet size, the authors create an intuitive, user-centric visualization that is 15.93% more accurate in representing social ties than traditional single-metric methods.
Background: Beyond the Binary "Friend"
Most social networks treat "friendship" as a binary state—you are either connected or you aren't. However, human relationships are a spectrum. Prior research has attempted to model "tie strength," but communicating this complexity to the end-user remains a challenge. The authors argue that the increasing volume of interaction data is often neglected because its manual analysis is too tedious.
The Linear Model: Defining Digital Gravity
The authors identified seven key dimensions of interaction on Facebook:
- Likes and Comments on status updates.
- Likes and Comments on photos.
- Tagging behavior (bi-directional).
- Mutual friend ratios.
To determine the "weight" of each action, they conducted a survey where users rated the significance of these interactions. Surprisingly, Comments were rated as more significant (7.85/10) than Likes (7.45/10), reflecting a higher level of social effort.
The interaction frequency is defined as:
Methodology: Mapping Social Data to Physics
The core innovation lies in the translation of social weighted scores into a Unity 3D engine environment using physical laws.
1. The Architecture
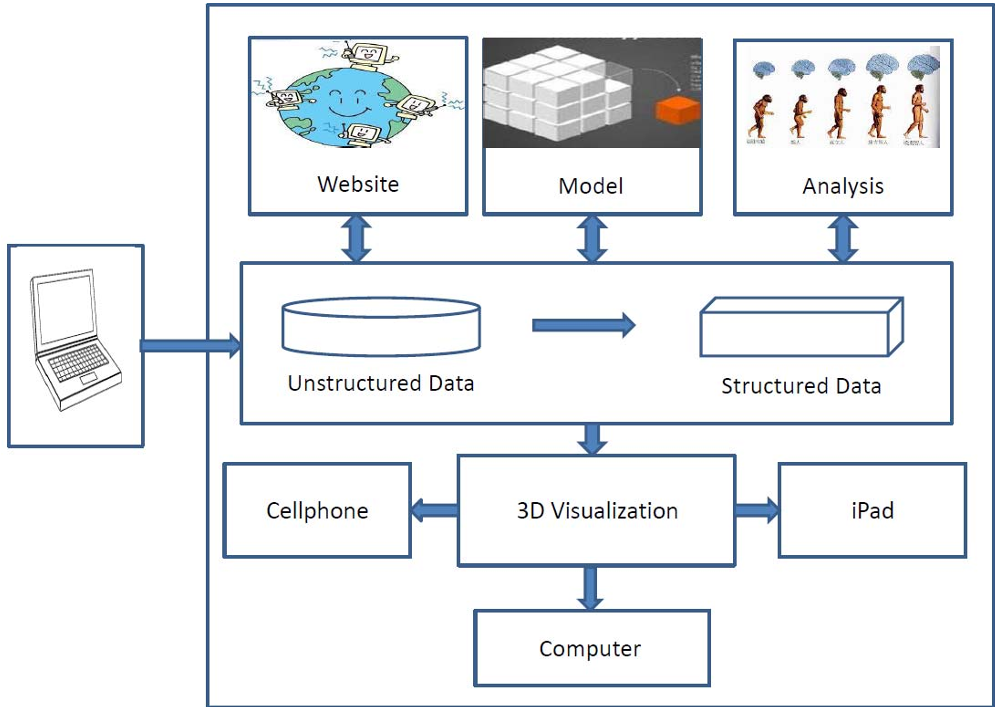 Fig 1: Functional overview showing the transition from unstructured Facebook data to a structured 3D scene.
2. Physical Mapping
To create the "Social Solar System," the system maps data to four specific physical variables:
- Planet Size: Represents the overall Interaction Frequency.
- Semi-Major/Minor Axis (): Determined by status update interactions. This shapes how "elliptical" or "circular" the friend's orbit is.
- Angular Velocity: Linked to photo-based interactions, determining how fast a friend "orbits" the user.
The visualization leverages Kepler’s Laws of Planetary Motion and Newton’s Law of Universal Gravitation to calculate the radius and speed of each friend-planet relative to the user (the Sun).
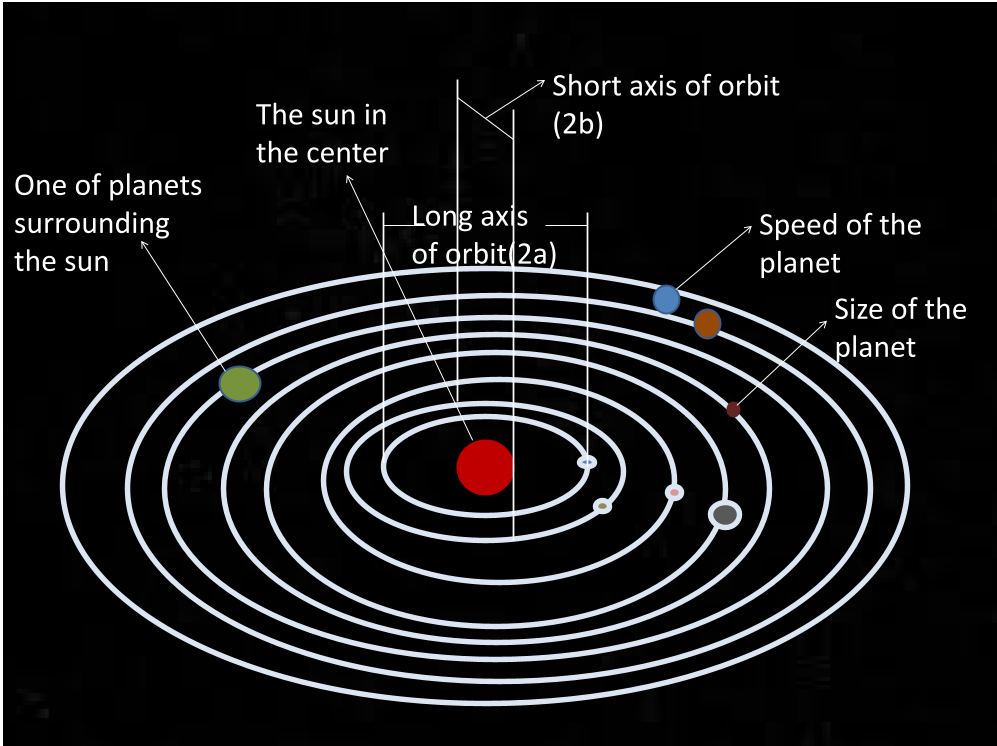 Fig 3: The mapping strategy between interaction variables and celestial physical parameters.
Experiments: Does it Actually Reflect Reality?
The authors validated their model by comparing the algorithmic ranking of friends against a subjective ranking provided by 10 volunteers (Ground Truth).
Key Results:
- The Combined Linear Model achieved significantly higher accuracy than any single feature (e.g., just looking at likes).
- Average Accuracy Improvement: 15.93%.
- Status Likes was the weakest individual predictor, while Comments for Photos was the strongest individual indicator of relationship rank.
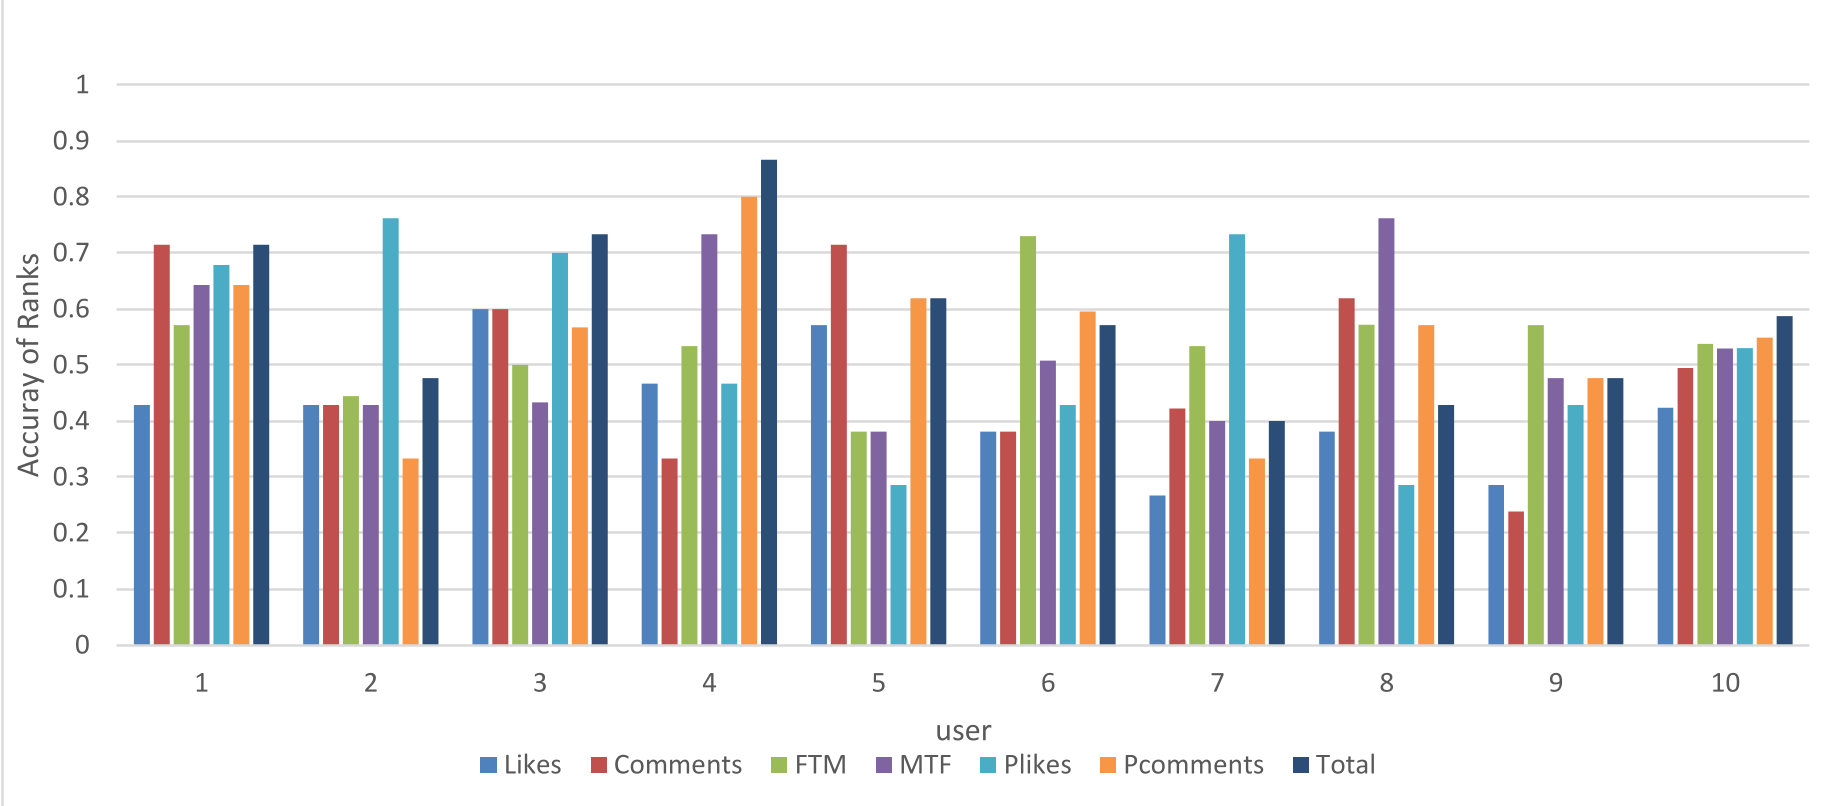 Fig 7: Comparison of ranking accuracy: the multi-dimensional model (All Features) clearly outperforms individual metrics.
Critical Insight & Conclusion
By utilizing the Solar System metaphor, the paper addresses the "cognitive overload" of big data. The nested nature of orbits allows users to instantly identify their "closest" friends (larger planets or specific orbital paths) without reading spreadsheets or complex node-link diagrams.
Limitations: The study focuses on Facebook, which has a specific interaction culture (e.g., photo-heavy). Furthermore, the sample size for ground truth (10 volunteers) is small, and the model does not yet account for private messages (IMs), which are arguably the strongest indicator of tie strength.
Future Work: Integrating dynamic data (showing orbits changing over time) could visualize how friendships drift apart or "gravitate" closer during major life events, providing a powerful tool for longitudinal social analysis.