
SDI: Bridging the Gap Between Environmental Factors and Global Health via Big Data GIS
A spatial data analysis infrastructure for environmental health research
This paper introduces a specialized Spatial Data Analysis Infrastructure (SDI) designed to correlate public health pathologies with environmental and climatic factors. By integrating a clinical data management module with a Hadoop-based Big Data backend, the system employs Getis-Ord Gi* statistics to identify significant "hot spots" of diseases like human infertility in relation to geographic pollutants.
TL;DR
The research presents a robust Spatial Data Infrastructure (SDI) that tackles the complex relationship between environmental pollution and health pathologies like infertility and cancer. By bridging clinical data collection, Hadoop-powered spatial mining, and GIS visualization, the authors provide a scalable method to identify statistically significant disease "hot spots" influenced by climate change.
Background & Motivation
In the era of climate change, the medical field is increasingly turning toward geographical epidemiology. We know that air quality and temperature shifts impact health, but proving these correlations requires processing massive, disparate datasets. Traditional GIS tools often buckle under the weight of "Big Data" or remain siloed from the clinical workflow.
The authors identify a critical gap: the lack of a unified infrastructure that can ingest clinical folders, geocode them, perform rigorous statistical analysis (beyond simple mapping), and visualize the results for institutional decision-making.
Methodology: The Three-Tier Architecture
The proposed SDI is not just a map; it is a full-stack data pipeline designed for scalability.
- Clinical Layer: A gynecological-obstetrical clinical folder (built on FileMaker Pro) collects patient history and geo-referenced residence data.
- Data Layer (The Engine): This is the core of the innovation. Instead of standard SQL, the authors use HiveQL on a Hadoop cluster to run the Getis-Ord Gi statistic*.
- Presentation Layer: Utilizing GeoServer and OpenLayers, the system renders the analytical results into interactive heat maps.
The Spatial Logic: Getis-Ord Gi*
The choice of the Getis-Ord Gi* statistic is pivotal. Unlike simple density maps, this method calculates a Z-score for each area. A high Z-score (a "hot spot") indicates a cluster of high values that is statistically unlikely to have occurred by random chance.
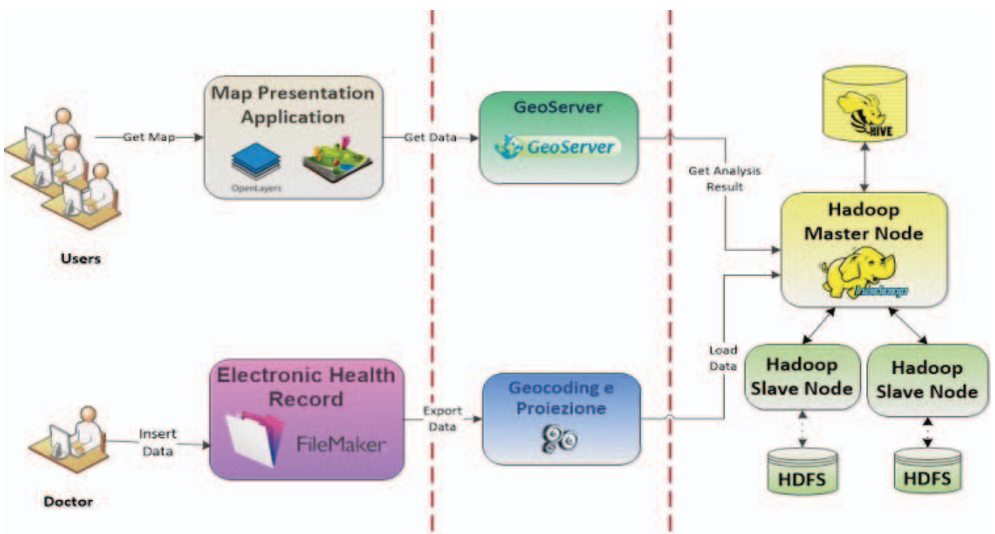 Fig 1: The architecture flow from patient data extraction to Hadoop processing and GIS output.
The paper details a rigorous data preparation workflow:
- Geocoding: Converting addresses to Lat/Long using Google Maps API.
- UTM Projection: Projecting coordinates to a Cartesian plane (WGS84 UTM Zone 33) to allow for accurate Euclidean distance measurements.
- Spatial Join in Hive: Using the ESRI Spatial Framework to aggregate patient points into administrative or regular hexagonal/square grids.
Experimental Validation & Case Studies
The system was tested across three distinct domains in the Apulia region of Italy:
1. Infertility Monitoring
Analysis of ~500 patients showed a significant hot spot in the urban area of Lecce. While potentially influenced by population density, this provides a baseline for correlating these clusters with urban air pollutants.
2. Environmental Hazards (Fires)
Using the OFIDIA project dataset (2000-2012), the SDI mapped over 5,000 fire events.
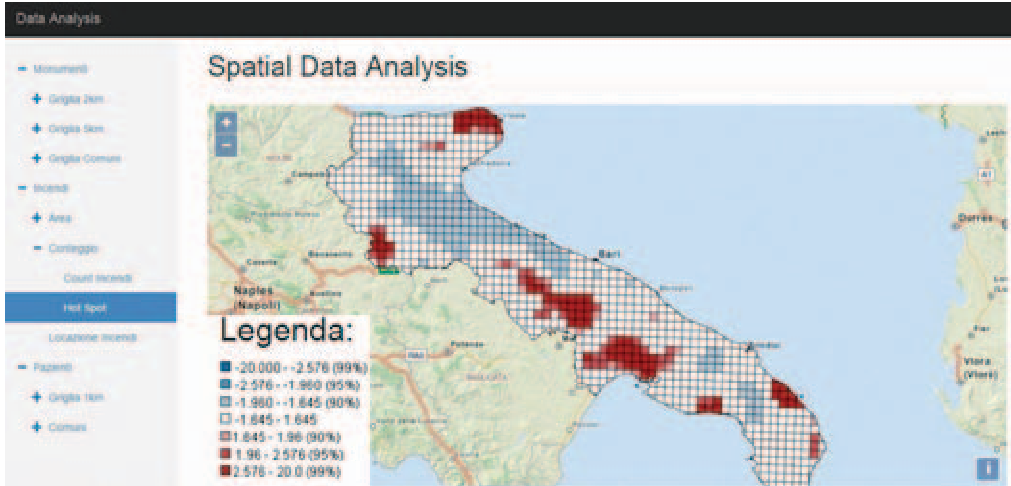 Fig 2: Hot spot (Red) and Cold spot (Blue) analysis of fire occurrences in Apulia.
The results clearly identified high-risk "hot spots" in the Gargano and Bari provinces, while simultaneously identifying "cold spots" (areas with lower-than-average fire density), demonstrating the bidirectional sensitivity of the Getis-Ord statistic.
3. Cultural Heritage
By processing a dataset of "Points of Interest," the authors proved the system's robustness across different data types, highlighting high-density tourist clusters in Salento.
Critical Insight & Future Outlook
The true value of this work lies in its scalability. By moving the spatial analysis from a localized GIS desktop application to a Hadoop/Hive cluster, the researchers have future-proofed the system for the eventual integration of planetary-scale climate data (e.g., NetCDF files).
Limitations: The current health data represents a small sample size from a single clinic. However, the infrastructure is built to support a "Cloud environment" for anonymized data sharing across multiple institutions.
Conclusion: As we enter an era where "Environment as a Service" data becomes more accessible, infrastructures like this SDI will be essential for translating raw environmental metrics into actionable public health interventions.