
GIS-Driven Strategic Insight: Beyond "Intuition" in Healthcare Facility Siting
Spatial data visualization in healthcare: supporting a facility location decision via GIS-based market analysis
This paper presents a Geographic Information System (GIS)-based market analysis to optimize the siting and sizing of a Neonatal Intensive Care Unit (NICU) in a rural healthcare network. By leveraging spatial data visualization and mining techniques within a Knowledge Discovery in Databases (KDD) framework, the authors identified critical patient travel patterns and competitor market shares to guide strategic facility location decisions.
TL;DR
Deciding where to build a specialized medical unit involves more than just counting local births. This paper demonstrates how Geographic Information Systems (GIS) and Knowledge Discovery in Databases (KDD) were used to visualize "market leakage" and competitor dominance in West Tennessee. The spatial insights ultimately forced a major healthcare system to pivot its strategy from a high-risk head-to-head competition to targeting underserved regional pockets.
The Problem: Flying Blind in Healthcare Expansion
For decades, healthcare systems expanded under a "build it and they will come" philosophy. However, in the modern era of managed care and razor-thin margins, capital investment is high-risk.
System M (a large urban provider) wanted to enter a rural market by building a Neonatal Intensive Care Unit (NICU). Their initial logic was simple:
- Build an 8-bed unit (their standard urban size).
- Locate it right next to the competitor’s flagship hospital to disrupt their dominance.
The flaw? This decision was made based on internal data and general demographics, completely ignoring competitor market share and patient travel behavior.
Methodology: Spatial Data Mining & KDD
The authors moved beyond traditional statistics by employing Spatial Data Mining. They utilized public birth certificate records from the Bureau of Vital Statistics, which provided a granular view of where mothers lived versus where they eventually delivered.
1. Market Share Visualization
Instead of looking at population maps, the authors created Thematic Maps. They calculated market share by zip code, which revealed "islands" of dominance and "vulnerable" buffer zones.
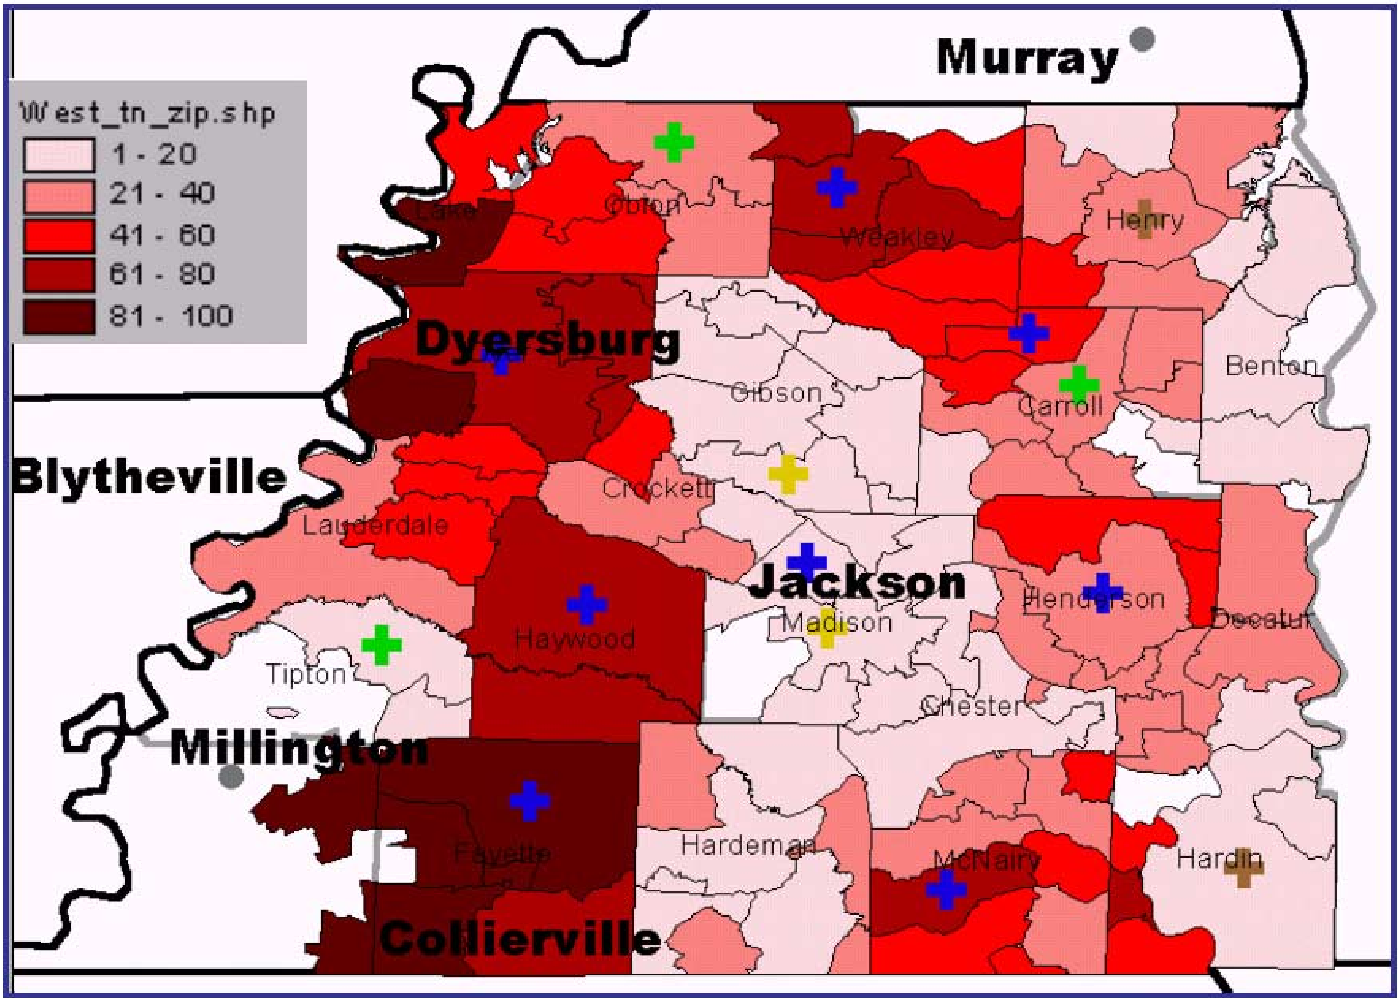 Figure 6: Visualizing the stark difference between System W (competitor) core dominance and System M's peripheral presence.
2. Import/Export Analysis
A crucial part of the "Methodology" was analyzing inter-county travel. Even if a county had a hospital (System M), residents often bypassed it for a larger medical center (System W). By visualizing these "Exports" via pie charts, the authors identified exactly where System M was losing its "cradle-to-grave" customer base.
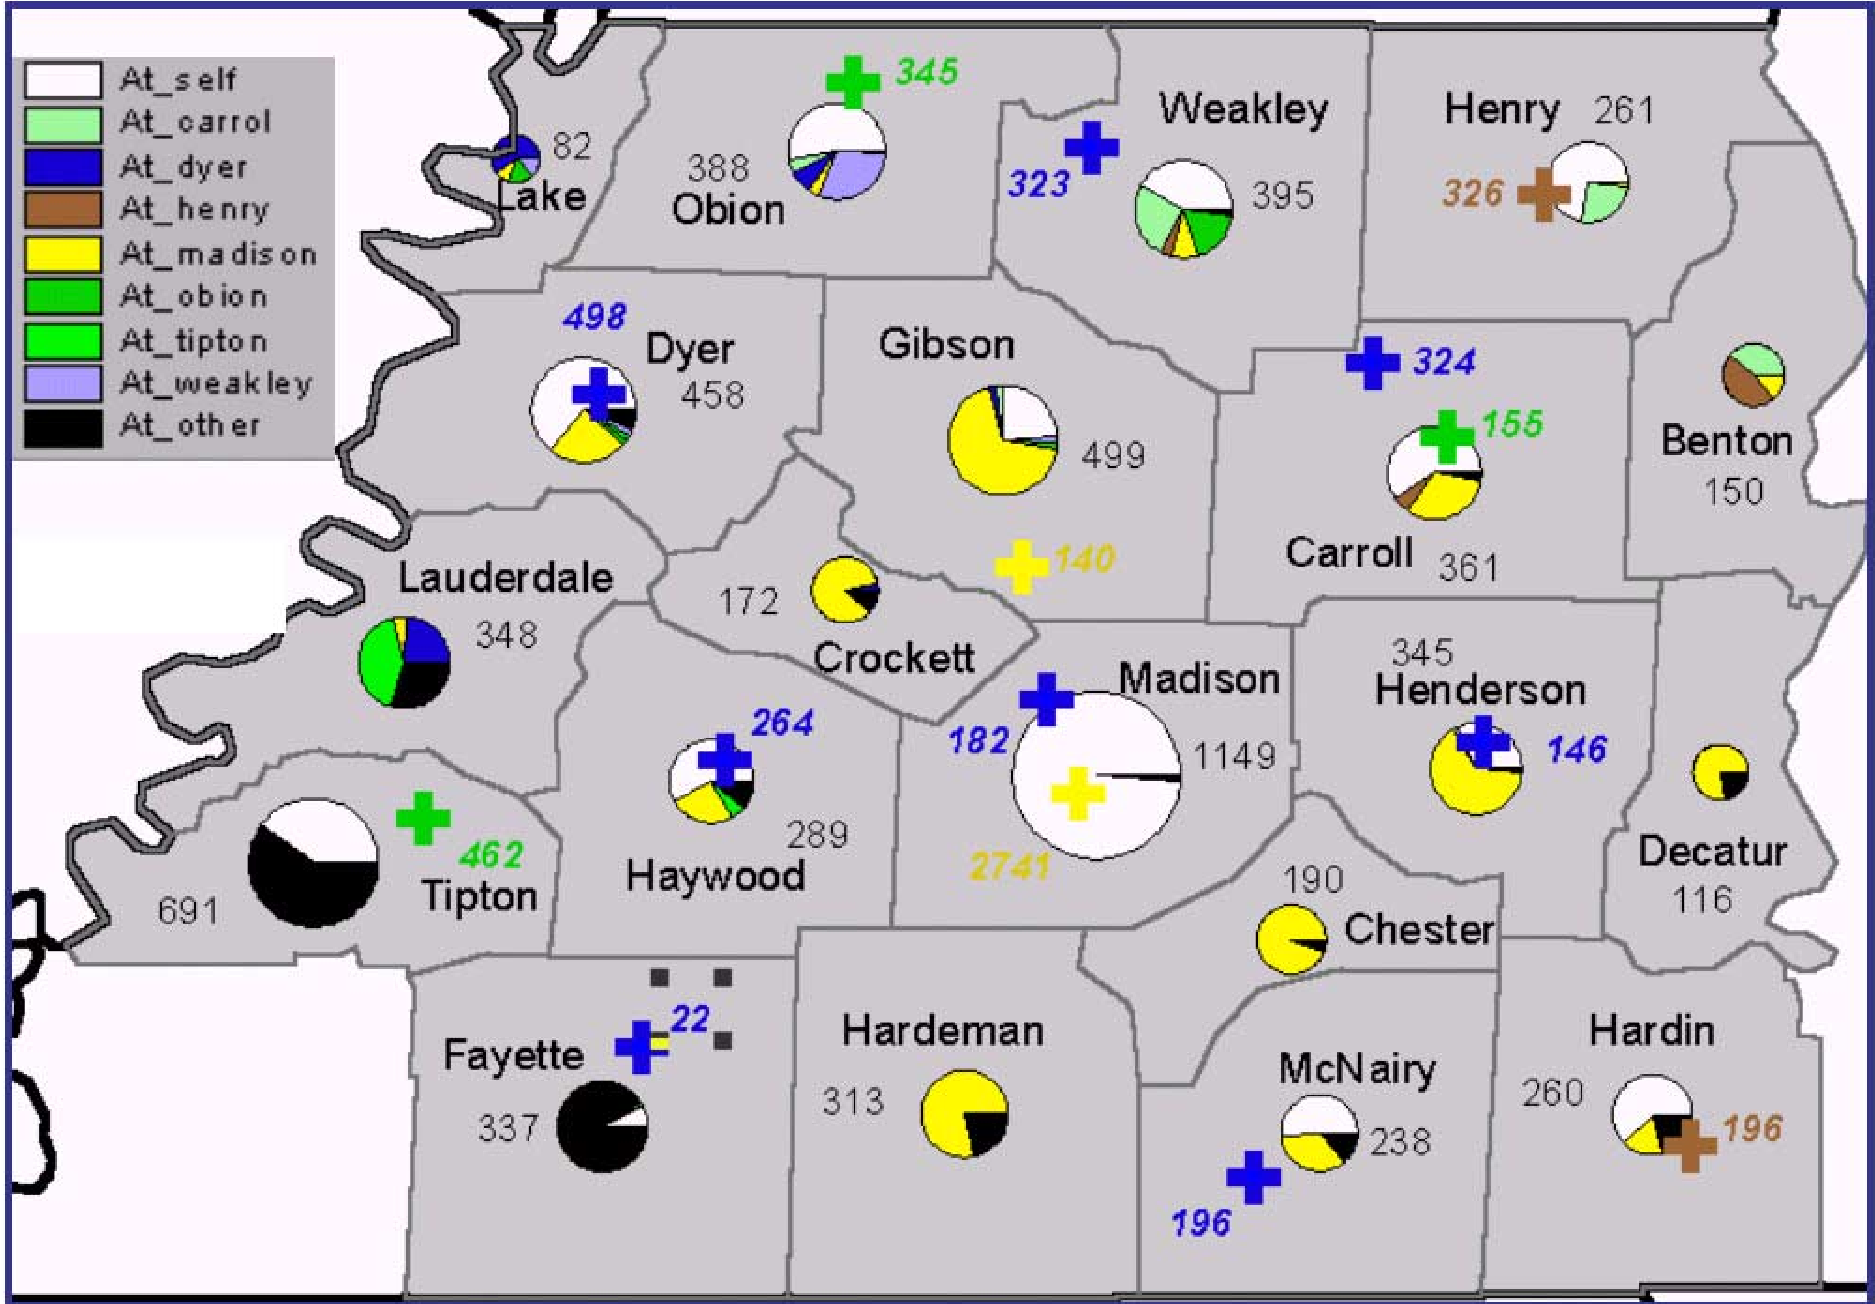 Figure 8: Highlighting how residents in peripheral counties bypass local facilities for the central hub.
Critical Results: A Strategic Pivot
The results were a wake-up call for System M:
- The "Invisible" Competitor: The main competitor (System W) performed 46% of regional deliveries despite having fewer hospitals, thanks to a centrally located "tertiary center" draw.
- The Leakage: Counties like Dyer were losing 33% of potential deliveries to other regions despite having a local System M facility.
- Strategic Re-alignment: The GIS visualization suggested that trying to build a NICU in the competitor's core county was likely to fail. Instead, a 6-county area to the north was identified as the ideal "battleground" where residents were traveling long distances and might prefer a closer System M unit.
Deep Insight & Conclusion
The value of this work lies in its application of the KDD Process. While the data itself was "just" tabular birth records, the spatial visualization acted as a broadband channel for information flow, revealing hidden patterns of human behavior (travel preference) that raw numbers couldn't show.
Takeaway for Tech-Leaders: In any business involving physical locations, your internal data is only half the story. Success depends on understanding the Spatial Interaction—how competitors influence geography and how customers "bypass" your nodes. GIS isn't just for making maps; it's a diagnostic tool for identifying market vulnerabilities.
Limitations: The paper relies on 1997 data, and today’s analysis would likely include real-time traffic data, socio-economic modeling, and insurance network constraints. However, the core principle remains: Spatial context is the ultimate filter for strategic clarity.