
Digital Footprints as a Social Mirror: Can Twitter Replace the National Census?
Comparison between spatial distributions of tweet base and population in Japan
This study investigates the feasibility of using geolocated Twitter data as a real-time proxy for national census and lifestyle surveys in Japan. By analyzing over 127 million tweets from 1.5 million users, the authors proposed a "tweet base" identification method that achieved a correlation coefficient of 0.83 with official night-time population statistics.
TL;DR
Researchers in Japan have demonstrated that one year of geolocated Twitter data can accurately reproduce both the spatial distribution of the national population and the daily rhythm of life (the "awake-at-home" probability). With a correlation coefficient of up to 0.86, this study suggests that big data from SNS can serve as a real-time, low-cost alternative to traditional, infrequent public surveys.
Background & Motivation: Beyond the 5-Year Cycle
National censuses are the bedrock of urban planning, yet they are remarkably static. In Japan, they occur every five years; in the US and UK, every ten. This slow cadence cannot capture the rapid dynamics of modern societies or the immediate impact of disasters. Moreover, for developing nations, the sheer cost and infrastructure requirements of a census are often prohibitive.
The authors' core insight was simple but profound: if we can identify where a user "lives" on Twitter (their tweet base), we can aggregate these bases to mirror the national population distribution, and use the timing of their tweets to understand national lifestyle patterns.
Methodology: Definition of the "Tweet Base"
To bridge the gap between digital data and physical census, the researchers divided Japan into a grid of 1-km x 1-km "meshes."
- Spatial Identification: By mapping 127 million tweets, they identified the specific mesh from which each of the 1.5 million users tweeted most frequently. This was designated as the user's "tweet base area."
- Temporal Analysis: They calculated the Tweet-from-Base Probability—the ratio of tweets sent from the base area versus tweets sent from anywhere else—in 15-minute intervals.
The beauty of this approach is that it transforms messy, error-prone GPS data into a statistically significant aggregate that filters out the "noise" of travel and commuting.
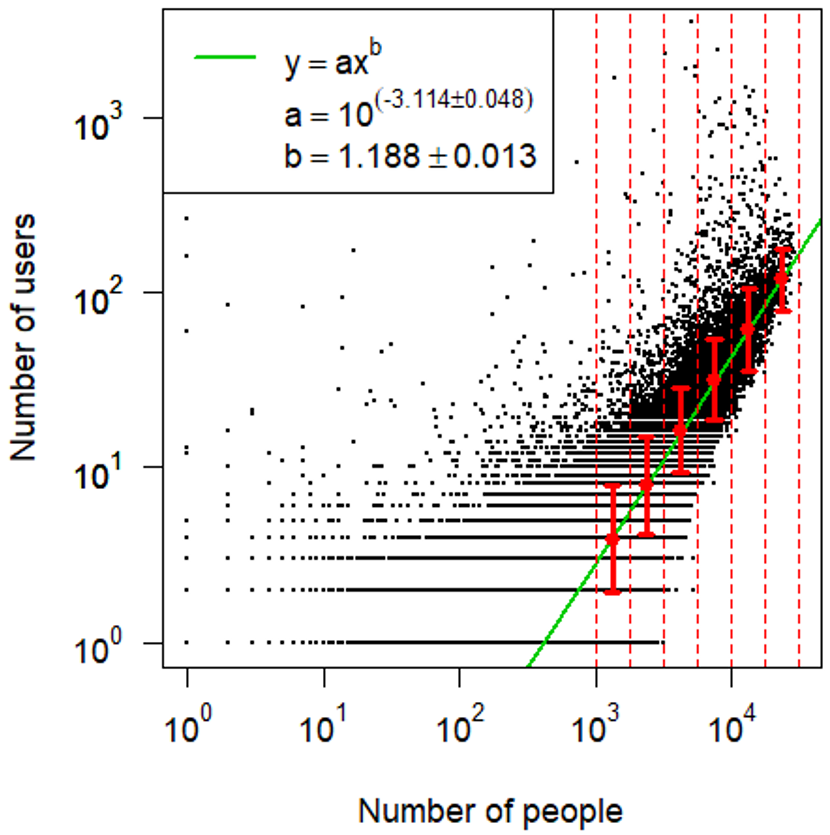 Figure 1: The strong correlation (r=0.79) between the census population (x) and the density of Twitter "tweet bases" (y).
Evaluation: The Digital Heartbeat vs. Ground Truth
The study compared Twitter data against two gold-standard datasets: the 2015 Japanese Census (Night-time Population) and the NHK National Lifestyle Time Survey.
1. Spatial Fidelity
The correlation was strongest among users in their 20s and 30s (r=0.83). Interestingly, the regression line for this demographic followed a near-perfect relationship, suggesting that for young adults, Twitter is an almost perfect proxy for geographic distribution.
2. Temporal Fidelity
The study compared the "tweet-from-base" probability to the "awake-at-home" probability (the percentage of people awake and at home). The results were striking:
- Weekdays: A correlation of 0.86. The data perfectly captured people leaving for work in the morning and returning in the evening.
- Weekends: A correlation of 0.78. The lower correlation is attributed to "irregular" tweeting habits when people are less bound by work schedules.
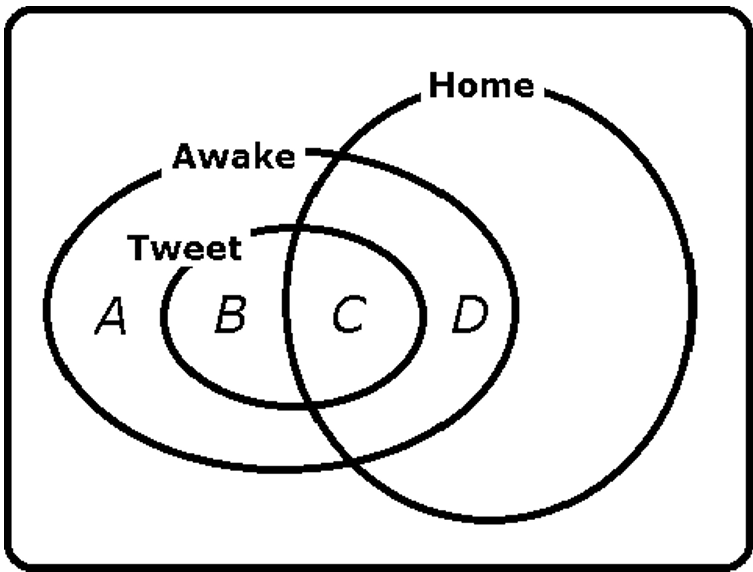 Figure 2: Daily changes of tweet-from-base (Black) vs. awake-at-home (Red) probabilities, showing high synchronicity.
Critical Insight: The Tweet-Location Gap
The authors even accounted for the behavioral nuances of why the digital data might slightly deviate from physical surveys. They categorized users into four types (A, B, C, D) based on whether they were at home/away and tweeting/silent. Their mathematical model explains that discrepancies occur because people are less likely to tweet while "getting dressed" at home or while "focused on work" at the office—a subtle but important distinction between being physically present and being digitally active.
Outlook and Future Work
This research confirms that geolocated social media data can act as an effective "sensor" for human society. The authors suggest that this method could be deployed to analyze specific risks, such as determining how many individuals with "low disaster awareness" (profiled via their tweets) live in high-risk floods or earthquake zones.
While there are clear demographic biases—Twitter users are younger and more tech-savvy—the high reproducibility for these groups provides a powerful tool for real-time urban sensing where traditional census data fails to keep pace.