
Mapping Radicalism: Spatio-Temporal Signal Recovery from Indonesian Twitter Data
Spatio-temporal Signal Recovery from Political Tweets in Indonesia
This paper presents a framework for recovering spatio-temporal political signals from Twitter data in Indonesia. By calculating a Radicalization Index (using sparse linear regression) and a Location Index (via a mixture of declared and geo-tagged data), the authors generate monthly Heat Maps that visualize the prevalence of radical ideologies across 34 Indonesian provinces.
TL;DR
Researchers from Arizona State University have developed a system to visualize the geographic spread of radical and counter-radical sentiments in Indonesia. By fusing sparse GPS data with text-regression analysis of over 12 million tweets, they created "Heat Maps" that pinpoint radicalization hubs. Their results achieved 98% classification accuracy and were validated by real-world reports from the Wahid Institute.
Problem & Motivation: The "Lone Wolf" and Sparse Data Challenge
Monitoring political stability in a country as vast as Indonesia is a monumental task. While social media provides a "human sensor" network, researchers face two critical hurdles:
- Data Scarcity: Less than 1% of tweets are geo-tagged.
- Contextual Ambiguity: 140 characters are rarely enough to determine if a user is truly radical or simply using specific terminology.
Existing methods often ignore users without GPS data or fail to account for the fact that people often lie or are vague about their "home" location in their profiles (e.g., listing "Dark side of the moon" as their location).
Methodology: The Dual-Index Framework
The core of this research is the combination of two distinct indices into a single Heat Index (H) for each province.
1. The Radicalization Index (RD)
Instead of analyzing individual tweets, the authors aggregate all of a user's tweets into a single "User Document." They then apply Sparse Linear Regression (L1-regularization).
- The Logic: The model is trained on long-form documents from known radical and counter-radical organizations.
- Sparsity: Since the vocabulary is huge but documents are relatively short, L1-regularization helps identify the "pivot words" that truly signify radical intent.
2. The Location Index (L)
To solve the lack of GPS data, the authors use a probabilistic approach:
- CHL (Computed Home Location): A correction matrix that adjusts a user's "Declared" location based on global movement patterns observed in the data.
- CGL (Computed Geo Location): The distribution of actual GPS pings from the user.
- Adaptive Weighting (): If a user has many GPS-tagged tweets, the system relies on those; if not, it defaults to the corrected declared location.
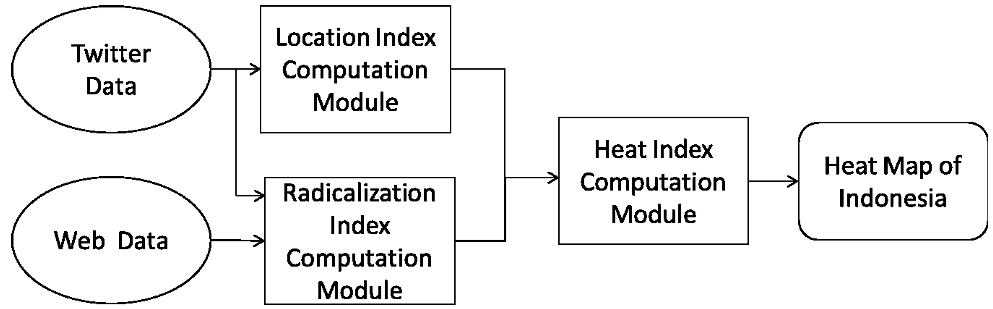 Figure 1: The flow diagram shows how web crawling and Twitter streaming converge to produce the final Heat Map.
Experiments & Validation
The team analyzed 12.1 million tweets over a three-month period (Oct 2012 – Jan 2013).
Key Findings:
- Hotspots: Jakarta, East Java, and Yogyakarta consistently showed the highest radicalization scores.
- The Jakarta Effect: The "Computed Home Location" matrix revealed that many users identifying with distant provinces (like Papua) were actually tweeting from Jakarta, reflecting the capital's role as a population magnet.
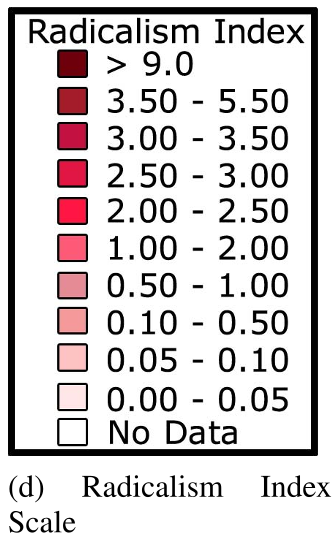 Figure 2: Monthly Heat Maps showing the intensity of radical signals across the Indonesian archipelago.
Validation against Ground Truth
The authors compared their results with the Wahid Institute's 2012 Annual Report. Three of the four most radical provinces identified by the think tank—West Java, East Java, and Central Java—matched the top of the Twitter-derived list. The discrepancy in Aceh (high radicalism in report, low in Twitter data) was attributed to low internet penetration in that region, highlighting a known limitation of social media sensing.
Critical Analysis & Conclusion
Takeaway
The "Spatio-Temporal Signal Recovery" approach is a powerful proof-of-concept for political science. By moving from binary classification to a probabilistic distribution of location and sentiment, the researchers created a more resilient model that functions even when data is missing or noisy.
Limitations
- The "Aceh" Problem: The method is biased toward regions with high internet penetration and economic advancement.
- Socio-Linguistic Nuance: While sparse learning is effective, it may miss sarcasm or code-switching between Indonesian and local dialects.
Future Outlook
This methodology isn't limited to politics. The authors suggest it can be used for any "signal" recovery—from tracking the spread of a virus to monitoring consumer sentiment during a product launch across different geographic territories.
Technical Keywords: Sparse Learning, L1 Regularization, Spatio-Temporal Analysis, Twitter Mining, Sentiment Analysis.