
Tracking the Trajectory of Social Evolution: Spectral Embedding for Dynamic Networks
467_Spectral embedding for dynamic social networks.
The paper introduces a novel spectral embedding framework for dynamic social networks by binding temporal snapshots into a single global directed graph. This method enables the tracking of node trajectories and community evolution over time within a unified geometric space.
TL;DR
Most social network analysis treats time as a series of isolated "stills," making it impossible to see the "movie" of how individual relationships move. This paper proposes a mathematical framework to bind these time-steps into a single, unified geometry. By linking versions of nodes across time and applying a specialized directed Laplacian, the authors allow us to track the "flight path" of social entities, providing a powerful tool for investigative analysis.
The Geometry of Change: Why Static Snapshots Fail
Spectral embedding is a staple in network science: it transforms complex graph structures into points in a 2D or 3D space where distance equals dissimilarity. However, if you embed Period A and Period B separately, the two "maps" won't line up. You can't say a node moved "left" because the "left" in Period B is mathematically unrelated to the "left" in Period A.
The authors identify two core challenges:
- The Alignment Problem: How do we create a common coordinate system for different time slices?
- The Asymmetry Problem: Social power is often directed (e.g., a boss giving orders). Most spectral methods assume undirected edges, losing critical hierarchy information.
Methodology: Binding Time with the "Google Trick"
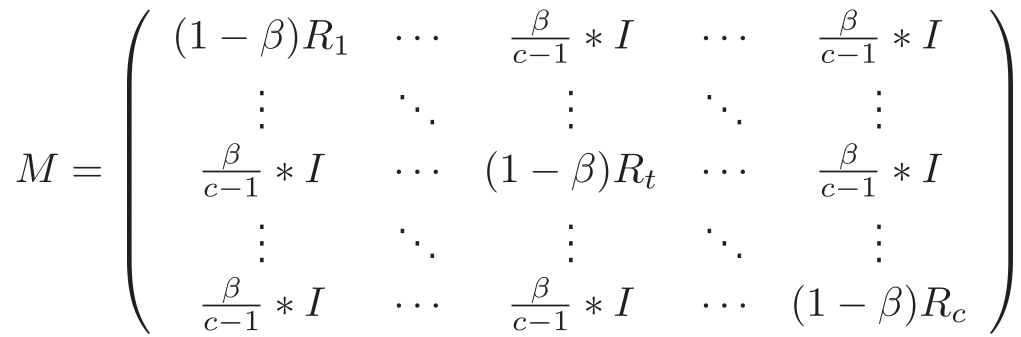
The core innovation lies in the construction of a Global Random Walk Matrix ().
1. Temporal Binding
Instead of looking at snapshots independently, the authors create a "super-graph." Every node in Phase 1 is connected to itself in Phase 2, Phase 3, and so on. This acts as a "tether" that keeps the embedding of a person somewhat consistent across time, while still allowing their position to shift if their social behavior changes.
- Smoothing (): Incorporates historical data into current snapshots to dampen noise.
- Binding (): Controls how strongly a node is "pulled" toward its other temporal versions.
2. The Directed Laplacian
Because phone calls and social influence have direction, the authors utilize a directed Laplacian based on the stationary distribution of a random walk. To avoid the "dead-end" problem where a random walker gets stuck in a sink node, they employ the Google Trick—adding a tiny probability () to jump to any node in the graph.
Empirical Evidence: Dissecting the "Caviar" Network
The authors applied their method to the real-world "Project Caviar" dataset—a 2-year investigation into hashish and cocaine trafficking.
Visualizing Disintegration
By embedding 11 phases of surveillance data, the model visualized how the criminal network reacted to police pressure.
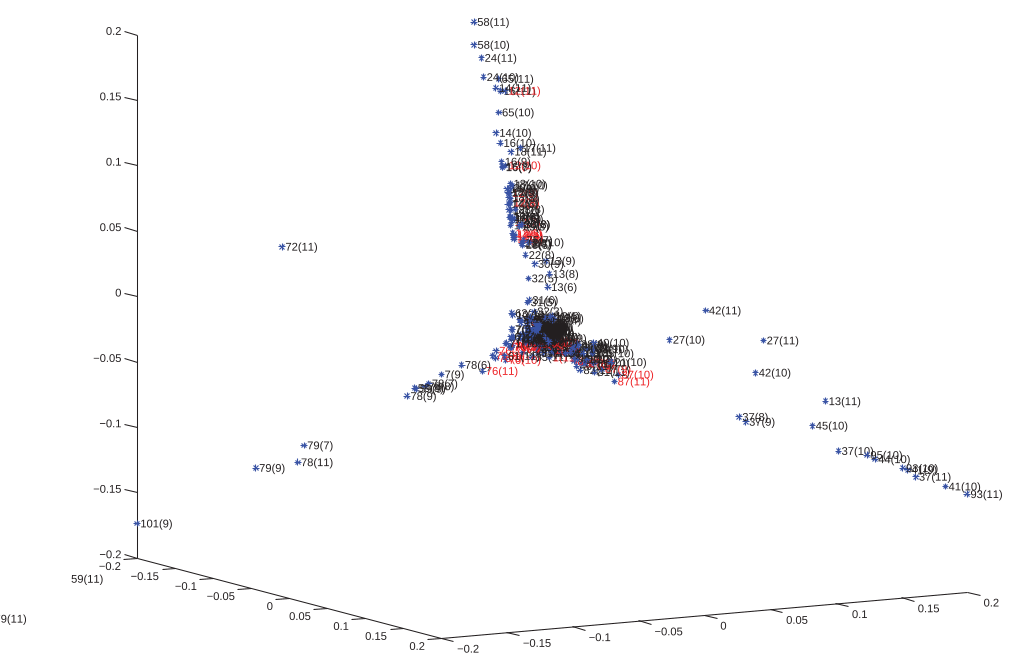
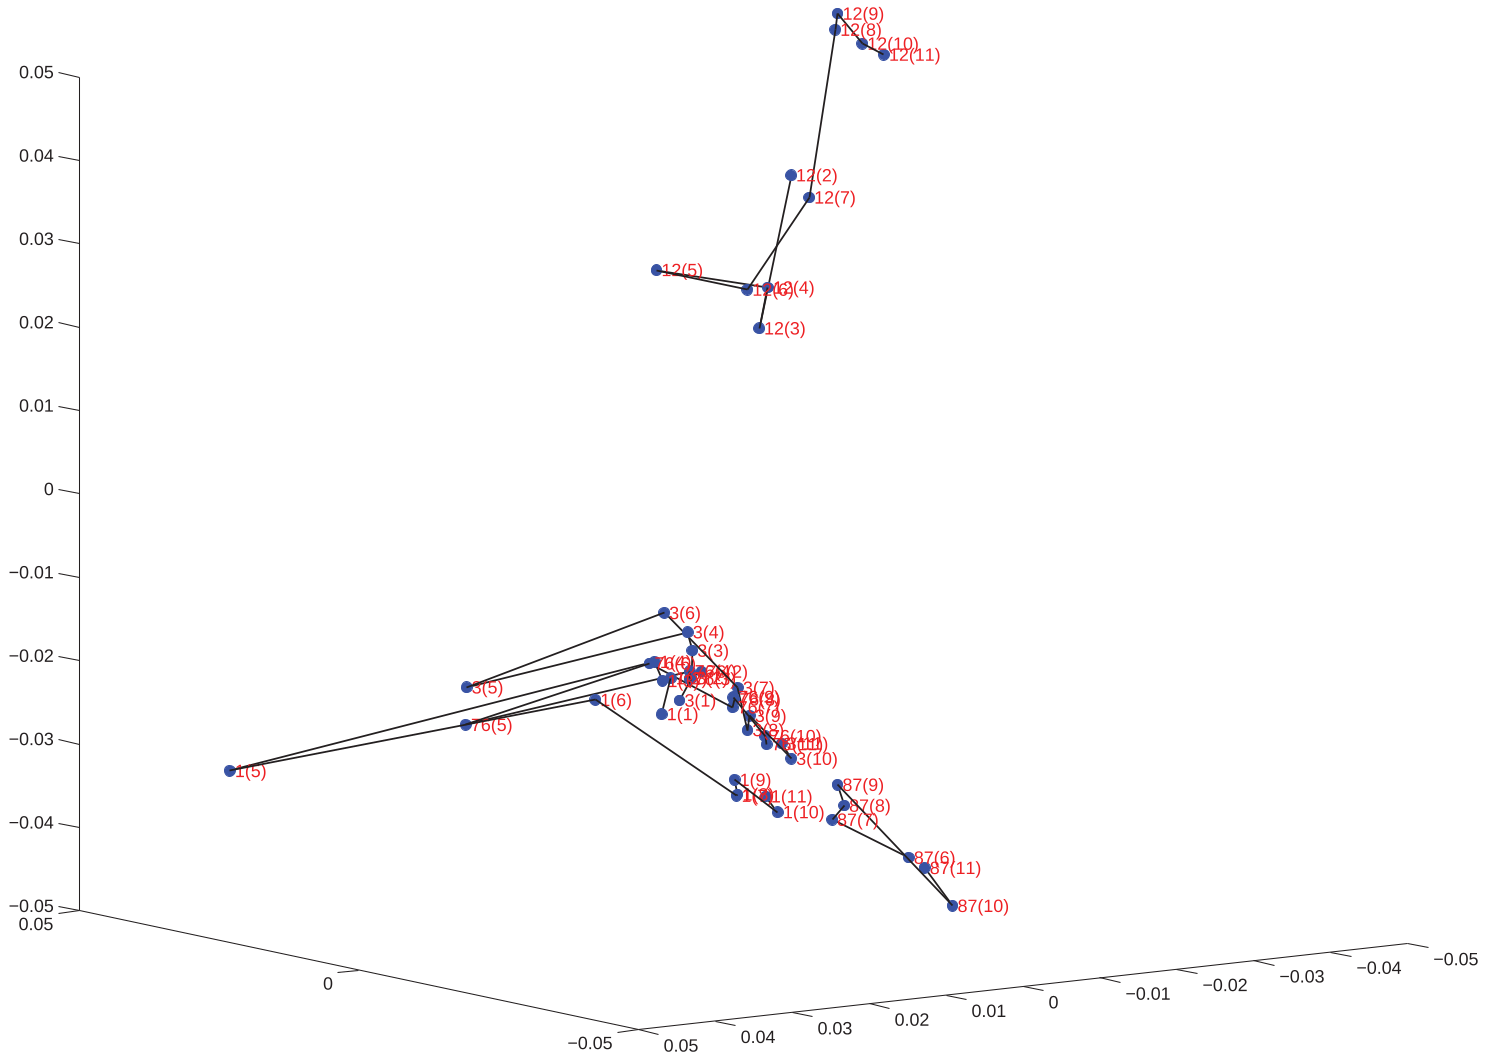
- Static View vs. Dynamic Trajectory: In a static aggregate (Fig 1), the network looks stable. But looking at the node trajectories (Fig 3 & 6), we see a dramatic "flight" where key coordinators (N1, N12) move away from the center of the graph as seizures occur, reflecting the breakdown of trust and the desperate attempt to insulate themselves.
The Power of Directed Analysis
The directed trajectory (Fig 6) revealed something the undirected version missed: intentionality. In the directed graph, N12 (cocaine coordinator) attempted to stay close to the power center in the late stages, but the other central figures were distancing themselves from him. This "asymmetric distancing" is a crucial insight for law enforcement.
Critical Insights & Future Directions
This work moves Spectral Embedding from a "photographic" tool to a "cinematic" one. By solving the alignment problem, it allows for:
- Anomaly Detection: Detecting sudden shifts in a node's trajectory as a precursor to network collapse.
- Hidden Influence: Detecting similarities between two individuals who never speak directly but share a "social orbit."
Limitations: The computational cost grows as , where is the number of phases. For massive social networks (millions of nodes), sparse matrix optimizations and incremental updates would be necessary.
Takeaway: If you want to understand where a network is going, stop looking at where it is and start looking at its trajectory in a unified spectral space.