
Decoding the Pulse of a City: Statistical Analysis of a Large-Scale Mobile Social Network
Statistical Analysis of Real Large-Scale Mobile Social Network
This paper presents a systemic statistical analysis of a large-scale Mobile Social Network (MSN) constructed from over 1.5 billion call records in China. By mapping 2.5 million users, the authors characterize the MSN as a typical scale-free, small-world network and uncover unique behavioral patterns correlated with age and gender.
TL;DR
This study provides a rare, large-scale look at the "hidden" social structures formed by mobile phone calls. By analyzing 1.5 billion records from a major Chinese city, the researchers confirmed that mobile networks follow scale-free and small-world properties. Most strikingly, the study maps social activity to human life cycles, revealing that social influence peaks in middle age and that an "activity flip" occurs between genders in later life.
Background: Beyond the Digital Footprint
While we often study social networks through the lens of Facebook or Twitter, the Mobile Social Network (MSN) is a more foundational reflection of daily human interaction. Unlike email or co-authorship networks, the ubiquity of the mobile phone captures ties across all demographics. However, due to data privacy hurdles, systemic analyses of these networks are infrequent. This paper bridges that gap by leveraging an enormous dataset and enriching it with age and gender metadata.
Problem & Motivation: The Scale and Demographic Gap
Existing Social Network Analysis (SNA) often faces two hurdles:
- Computational Complexity: Calculating metrics like "Betweenness Centrality" or "Diameter" for millions of nodes is mathematically expensive (O(mn) complexity).
- Contextual Vacuum: Most structural studies ignore who the actors are. The authors argue that a network's structure cannot be fully understood without knowing how factors like age and gender drive the connections.
Methodology: Mapping 2.5 Million Souls
The researchers built an undirected graph where an edge represents at least one call between two users.
1. Structural Properties
The network is not a single monolith but consists of over 56,000 sub-graphs. However, a "Giant Component" exists, encompassing 97.76% of all users, suggesting that almost everyone in a modern city is connected through a chain of "friends of friends."
2. Identifying the Actors
By decoding the Chinese Resident Identification Number (CRIN), the team assigned age and gender to each node. This allowed them to move beyond pure graph theory into Computational Social Science.
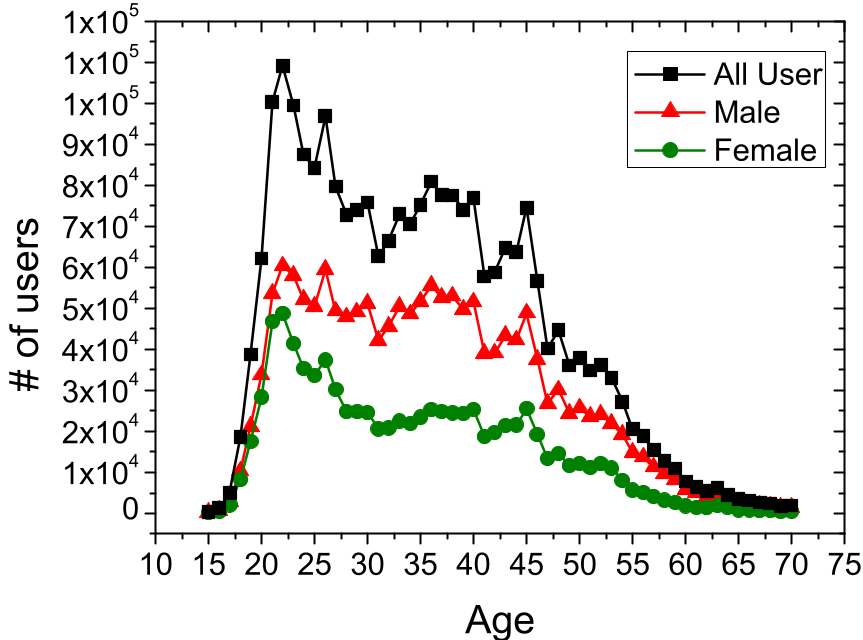 Figure 1: The distribution shows a concentration of users in the 20-45 age bracket.
Core Findings: The Geometry of Human Connection
The "Scale-Free" Nature with a Twist
The degree distribution (how many friends a person has) follows a power law, meaning a few "hubs" have many connections while most have few. Interestingly, the MSN shows a peak at degree five, unlike other networks that peak at one. This suggests a "social minimum"—most people maintain a core group of at least five frequent contacts.
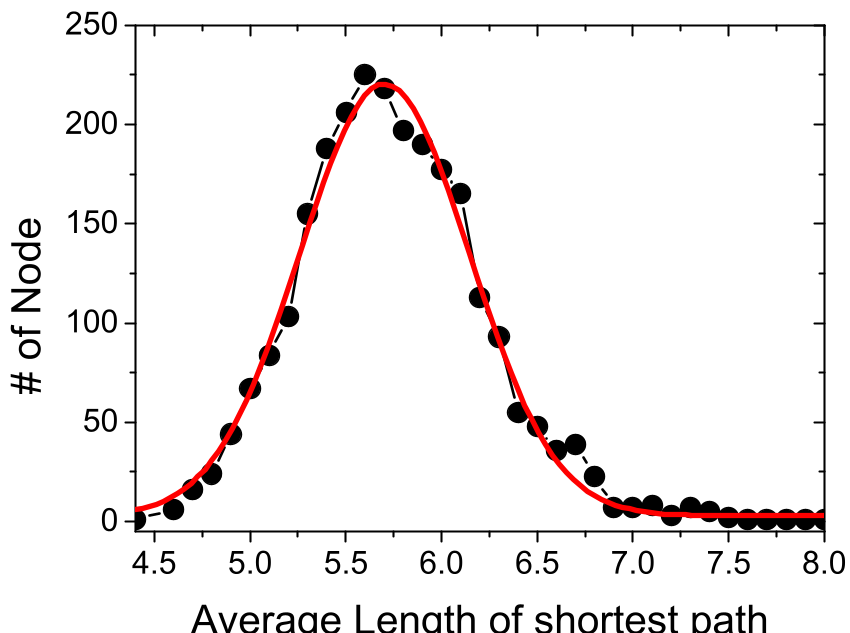 Figure 2: (a) Power-law distribution; (b) Average degree by age and gender.
The Small-World Effect
The study confirmed the famous "Six Degrees of Separation." The average shortest path was found to be 5.75. Even in a city of millions, you are rarely more than 6 "hellos" away from a stranger. The Clustering Coefficient (0.138) further proved that the network is "clumpy"—your friends are very likely to be friends with each other.
The Lifecycle of Social Influence
The most compelling aspect is the correlation between network metrics and age/gender:
- The Middle-Age Peak: Social activity (Degree) and importance in information flow (Betweenness Centrality) peak at age 40. This is the "career and family" zenith of social interaction.
- The Gender Flip: While men generally have higher degrees, the trend reverses after age 60. Older women become more central to their social networks than older men, a phenomenon the authors attribute to shifting life-cycle roles and domestic social management.
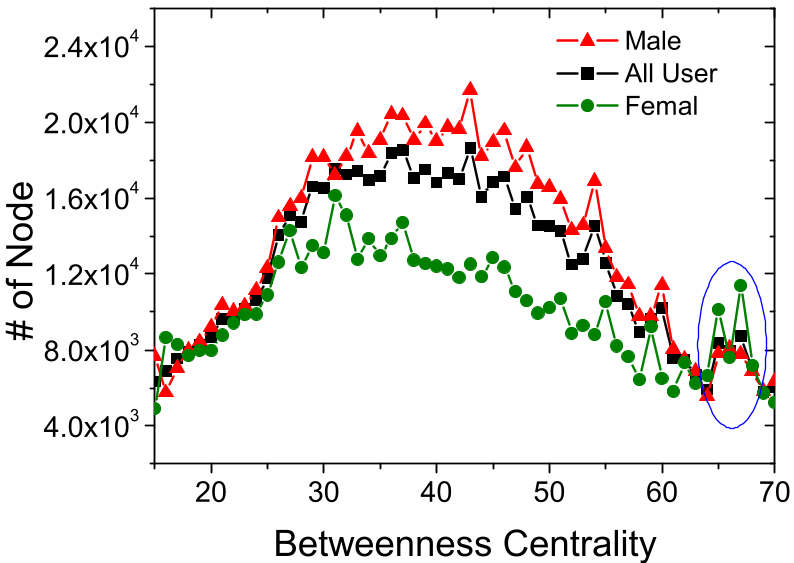 Figure 3: Betweenness centrality (social importance) showing the female surge in old age.
Critical Analysis & Conclusion
Takeaway
This paper proves that MSNs are Typical Small-World Scale-Free Networks. It provides a quantitative baseline for how human sociality evolves over a lifetime.
Limitations
The study treats a single phone call as a social bond, ignoring call duration and frequency, which would differentiate a "best friend" from a "delivery driver." Furthermore, as a snapshot from 2007, the data predates the era of mobile internet (WeChat, WhatsApp), which has likely shifted these dynamics even further.
Future Outlook
Future research should incorporate Temporal Dynamics—how do these networks change on a weekly or hourly basis? Understanding these patterns is crucial for everything from urban planning to controlling the spread of mobile viruses or even biological pandemics.