
[Medical Imaging] Statistical Ray-Splitting: Breaking the Hardware Barriers of CT Spatial Resolution
A Statistical X-ray Upsampling Technique for Enhanced Spatial Resolution in Computed Tomography
The paper introduces a statistical ray-splitting framework for upsampling X-ray sinograms to enhance CT spatial resolution. By incorporating a physics-based model of finite detector cell size and a Poisson-Gaussian noise model, the method recovers high-resolution data from low-resolution measurements without hardware modifications.
TL;DR
Researchers have developed a novel statistical learning-based upsampling technique that boosts Computed Tomography (CT) resolution without needing new hardware. By treating the physical detector's finite area as a statistical sampling problem rather than a fixed limitation, the "Ray-Splitting" algorithm recovers high-frequency details from standard sinograms, achieving over a 4x improvement in Modulation Transfer Function (MTF) for fine structures.
Background: The Physical Ceiling of CT Resolution
In the idealized world of analytical reconstruction (like FBP), X-rays are treated as infinitely thin lines. In the real world, an X-ray "beam" has a physical width determined by the detector cell size. This discrepancy acts as a low-pass filter, blurring the resulting image.
While hardware tricks like flying focal spots or quarter-detector shifts exist, they add mechanical complexity and often fail in helical scan modes. The motivation of this paper is simple: Can we use the statistical nature of photon counts to "guess" the high-resolution data hidden within a low-resolution bin?
Methodology: The Ray-Splitting Framework
The core innovation is an iterative "Ray-Splitting" algorithm that treats the high-resolution sinogram as a latent variable to be estimated.
1. The Physics Model
The authors model the observed intensity as a sum of virtual high-resolution rays : Where represents the geometric contribution. They assume a Gaussian approximation of the Poisson noise inherent in X-ray detection.
2. The Iterative Loop
The process follows a modified Expectation-Maximization (EM) logic:
- Ray-Splitting Step: Updates the high-res sinogram estimate () by maximizing a posteriori (MAP) given the current image model.
- Reconstruction Step: Uses to create a high-definition image .
- Reprojection Step: Projects the image back into the sinogram space to refine the statistical prior for the next iteration.
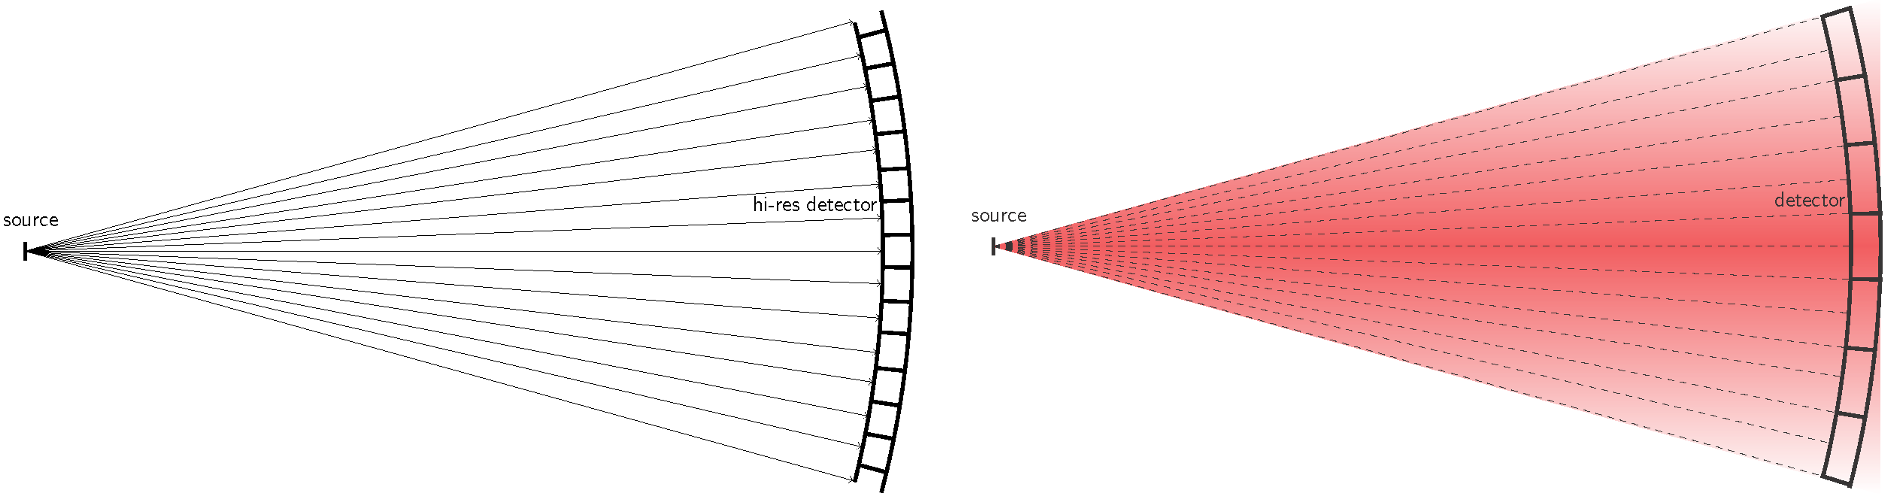 Figure 1: Comparison between ideal pencil-beam geometry (left) and actual finite detector geometry (right) that necessitates the ray-splitting approach.
Experimental Validation
The authors tested the method using the Catphan© 600 and QA phantoms, comparing it against various baselines including FBP, SART, and PDHG.
Quantifiable Gains
The results are striking. Looking at the Modulation Transfer Function (MTF) — the standard measure of a system's ability to transfer contrast at specific resolutions:
- FBP (Standard) at 6 lp/cm: 19.86
- FBP+ (With Ray-Splitting) at 6 lp/cm: 87.25
This represents a massive recovery of contrast in high-frequency regions (line pairs), effectively "sharpening" the image without the typical noise grain associated with high-pass kernels.
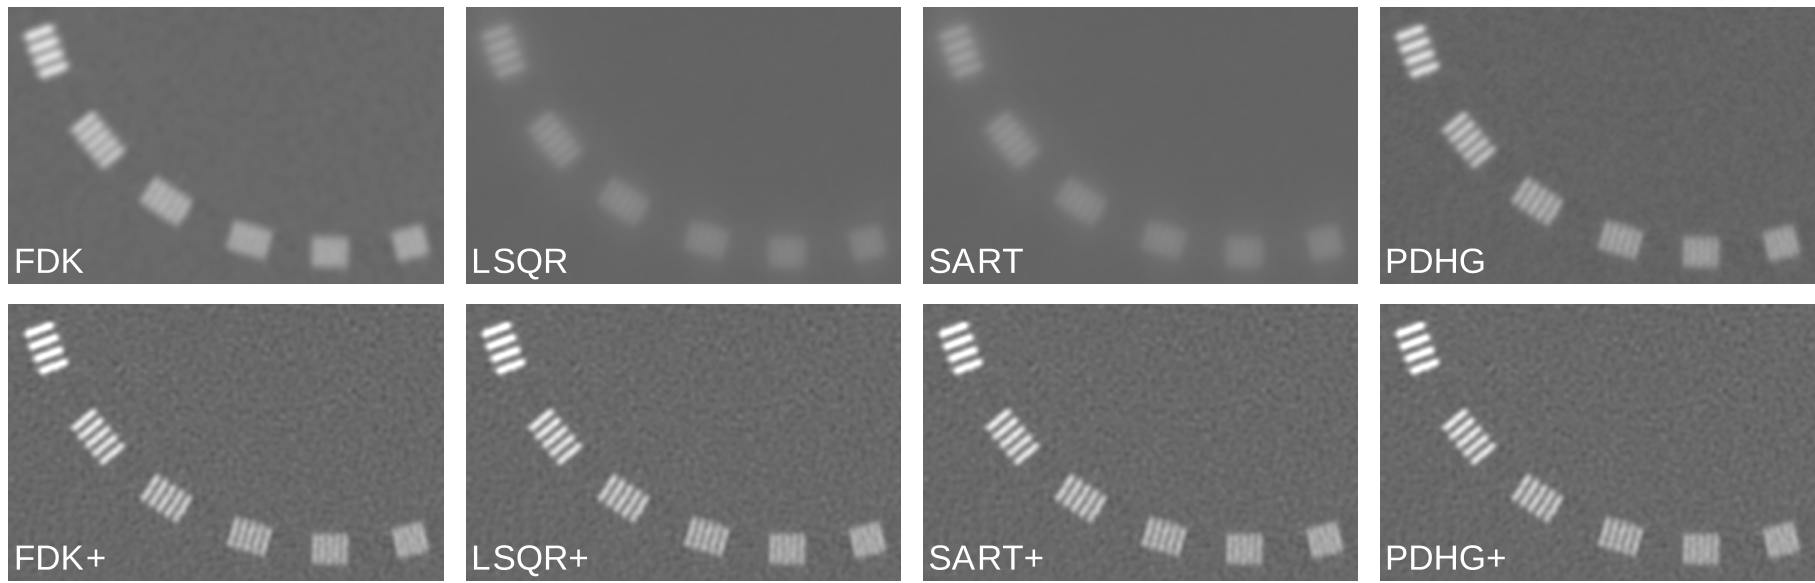 Figure 2: Visual comparison of Catphan experiments. The bottom row (FBP+, LSQR+, etc.) shows significantly clearer separation in high-frequency line pairs compared to the top row.
Critical Insight: Resolution vs. Noise
A common pitfall in image enhancement is that increasing sharpness usually increases noise. However, as shown in the SNR analysis (Figure 5), the ray-splitting algorithm stabilizes after a few iterations. Because the method incorporates the statistical noise model of the X-ray photons directly into the upsampling, it avoids the uncontrolled noise amplification seen in purely analytical deconvolution methods.
Limitations
- Computational Expense: Being an iterative forward-backprojection method, it is significantly slower than a single-pass FBP.
- Convergence: While it stabilizes in ~5-20 iterations, the "optimal" stopping point for clinical diagnosis remains a subjective variable.
Conclusion & Future Outlook
This paper proves that the spatial resolution of CT is not strictly "locked" by the physical size of the detector pixels. By mathematically modeling the signal as a composite of finer rays and using an iterative statistical framework, we can push CT systems beyond their hardware-rated specifications. This paves the way for high-precision imaging in older scanners or in portable CT units where high-density detector arrays are cost-prohibitive.
Takeaway for Researchers
- Inductive Bias: Physics-informed modeling outperforms "black box" upsampling.
- SOTA Position: This method acts as a pre-processing "plugin" that could potentially enhance any existing reconstruction pipeline (FBP, SIRT, or even DL-based).
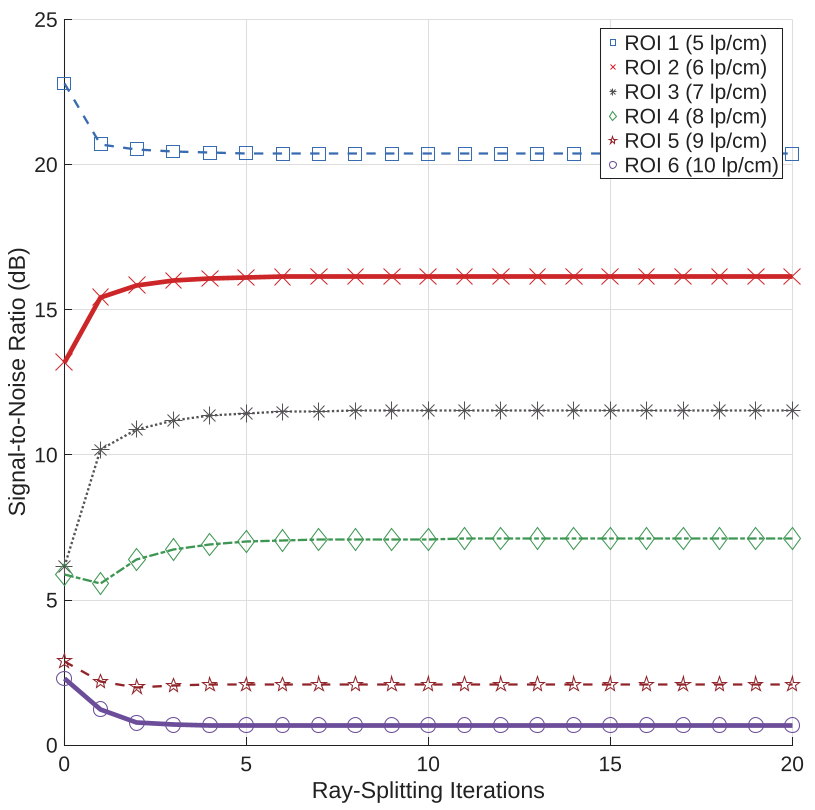 Figure 3: Proof of SNR stability during the upsampling process, ensuring quality is not sacrificed for resolution.