
The Stimulation Index: Identifying the "Spark Plugs" of Information Cascades
Stimulation Index of Cascading Transmission in Information Diffusion over Social Networks
The paper introduces the "Stimulation Index," a novel metric to quantify the importance of edges in social network information diffusion. Unlike traditional node-centric influence maximization, this method focuses on information cascades, identifying specific edges that trigger subsequent chain reactions in local communities.
In the world of social media, we often obsess over "influencers"—the high-degree nodes with millions of followers. However, have you ever wondered why a small, niche community suddenly explodes with excitement over a specific topic, even if it doesn't "go viral" globally?
A new paper from researchers at the University of Tsukuba and Tokyo University of Technology argues that we’ve been looking at the wrong thing. By focusing on edges (the transmissions) rather than just nodes (the users), they’ve developed a way to pinpoint the exact connections that act as catalysts for information chain reactions.
TL;DR
The researchers propose the Stimulation Index (SI). This metric quantifies how much a single information transmission stimulates subsequent transmissions. Tested on artificial networks, the SI proved more effective at identifying critical edges for local community "excitement" than traditional static centrality measures.
Why Nodes Aren't Enough: The Motivation
Most traditional models, like Influence Maximization, treat the network as a static map where the goal is to reach the maximum number of people. But real social networks are dynamic. A "trend" happens because a specific interaction triggers a chain of others.
The authors realized that an edge (a message or share) is not just a pipe for data; it is a stimulant. If Alice shares a post with Bob, and that specific act causes Bob to share it with five others, Charlie’s edge has a high stimulation value.
Methodology: Building the Edge-Relation (ER) Graph
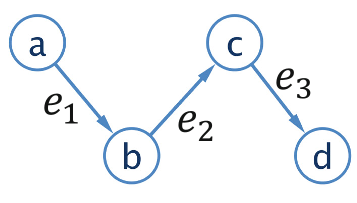
The core innovation lies in the transformation of the problem. Instead of looking at a graph of people, the authors create an Edge-Relation (ER) Graph.
- Direct Stimulation: If Edge A occurs at time and triggers Edge B at , a direct link is drawn in the ER graph.
- The DAG Structure: Because time only moves forward, this ER graph is a Directed Acyclic Graph (DAG).
- Recursive Scoring: Much like how Google's PageRank or Betweenness Centrality works, the Stimulation Index is calculated by tracing how much "influence" flows from an edge to all its subsequent "descendants" in the cascade.
Proving the Power: SIS-LT Model Experiments
The researchers didn't just use standard models. They used a SIS-LT (Susceptible-Infectious-Susceptible Linear Threshold) model. This accounts for human behavior: we get bored. They introduced a "reactivation" coefficient where the threshold for sharing a topic increases every time you see it.
Key Results
The team compared the Stimulation Index against Edge Betweenness Centrality and Edge-Degree Centrality.
- In Uniform Diffusion: The SI performed similarly to traditional metrics.
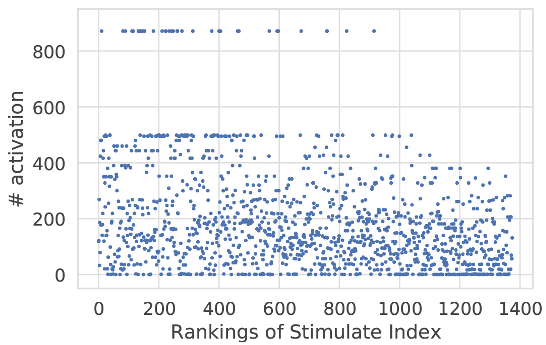
- In "Biased" (Community) Diffusion: The SI reigned supreme. By removing just the top 5% of edges ranked by SI, the researchers were able to "quench" the information spread much more effectively than by using other metrics.
Deep Insight: The "Black Edges"
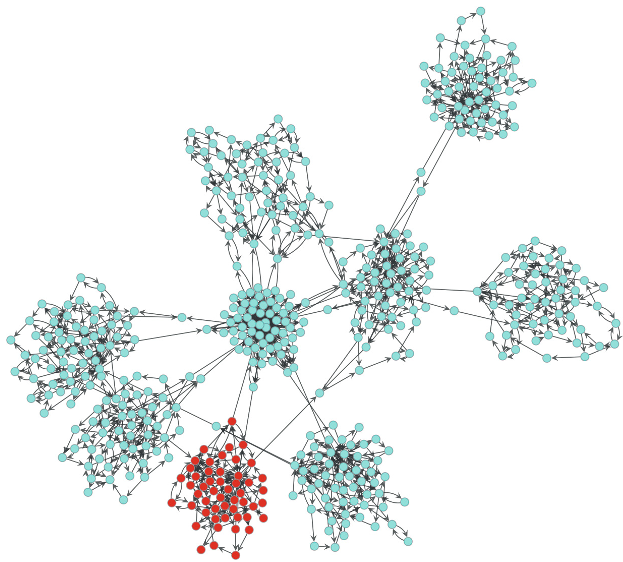
Perhaps the most fascinating find is what the authors call the "black edges." These are specific transmissions that stay within a community. While traditional metrics prioritize "bridge" edges (those connecting large groups), the Stimulation Index identifies the "spark plugs" that keep the fire burning inside a local group.
Critical Analysis & Future Outlook
The Stimulation Index is a significant step toward understanding the mechanics of excitement rather than just the mechanics of reach.
Limitations:
- The current study relies on artificial LFR networks. Real-world validation on Twitter or Mastodon datasets is the logical next step.
- The computational cost of building ER graphs for massive networks (billions of edges) could be high, requiring distributed graph processing.
Future Impact: This work has massive implications for Viral Marketing (knowing which specific interactions generate the most "buzz") and Crisis Management (identifying which rumors are likely to stimulate the most dangerous cascades).
By focusing on stimulation rather than just connection, we can finally start to measure the true "energy" of social networks.