
FastGen & Massive Social Networks: Scaling Epidemic Simulations to the Urban Level
Structural and algorithmic aspects of massive social networks
This paper investigates the structural and algorithmic properties of massive social contact networks using the TRANSIMS/EpiSims dataset for Portland, Oregon. It introduces "FastGen," a near-linear time random graph generation model based on the Chung-Lu (CL) framework, and provides high-performance approximation algorithms for computing structural invariants like clustering coefficients and dominating sets for epidemic control.
TL;DR
Researchers from Los Alamos National Laboratory and the University of Maryland have cracked the code for simulating massive, realistic social networks. By reimagining random graph generation and optimization algorithms, they've turned tasks that took hours into seconds, enabling real-time policy testing for epidemic control (like smallpox or SARS) in a virtual model of Portland, Oregon.
Background: The "Virtual City" Challenge
How do you model 1.6 million people and their daily interactions at 180,000 locations? This isn't just a theoretical exercise; it's the core of the EpiSims project. Traditional models like Erdős-Rényi are too simple—they don't account for the "celebrity locations" (malls, schools) that act as super-spreaders. Conversely, realistic bipartite models (People-Locations) were historically too slow to generate and analyze.
The Pain Point: The Quadratic Wall
The standard Chung-Lu (CL) model generates edges by checking every possible pair of nodes . For Portland, this means operations—a computational nightmare. Similarly, finding the best places to put disease sensors (the Dominating Set problem) is NP-hard, and the standard greedy approach hits a "quadratic wall" when facing millions of edges.
Methodology: Engineering Speed
1. FastGen: Near-Linear Graph Generation
The authors introduced FastGen-1. Instead of checking every pair, they use a prefix-sum array of "weights" (expected degrees) and partition nodes into blocks. By selecting edges via binary search over these weights, they reduce the complexity to .
 The bipartite structure where people (P) visit locations (L), forming the basis of the contact network.
2. FastGreedy: Smart Sensor Placement
To solve the Dominating Set problem (finding the minimum locations to monitor a population), they observed that social networks have high "overlap ratios." Because a few popular locations cover a vast majority of the population, a simple "sort-by-degree" heuristic—FastGreedy—yields results nearly identical to the optimal solution but at a fraction of the time.
Experiments and Results
The empirical validation is striking. As shown in the table below, FastGen-1 maintains the statistical integrity of the "Real-Network" while being orders of magnitude faster.
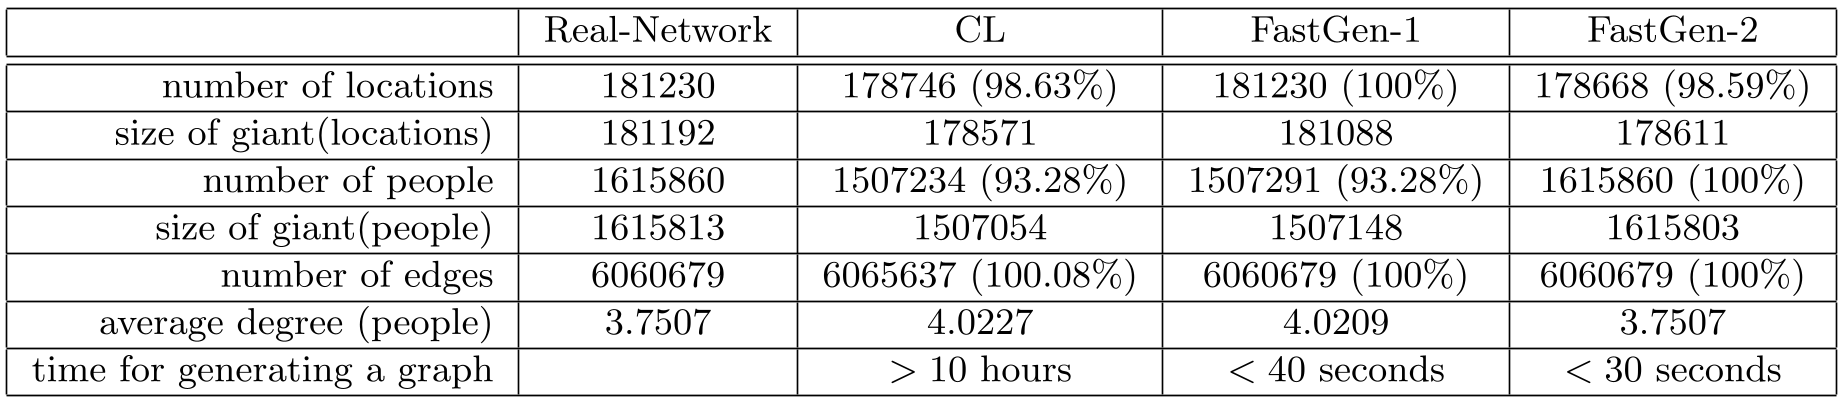 Table 1: FastGen-1 generates the Portland graph in <40s, while the original CL model takes >10 hours.
The "Small-World" of Portland
The study confirmed that despite the massive size, the social network is tightly connected. The shortest path distribution shows that most people are connected to any other person by just 2 or 3 intermediates in the "people-people" projection.
Power-Law Dynamics
The location degrees follow a power law with an exponent . This means that while most locations have few visitors, a tiny minority have massive throughput—the critical "hubs" for both commerce and contagion.
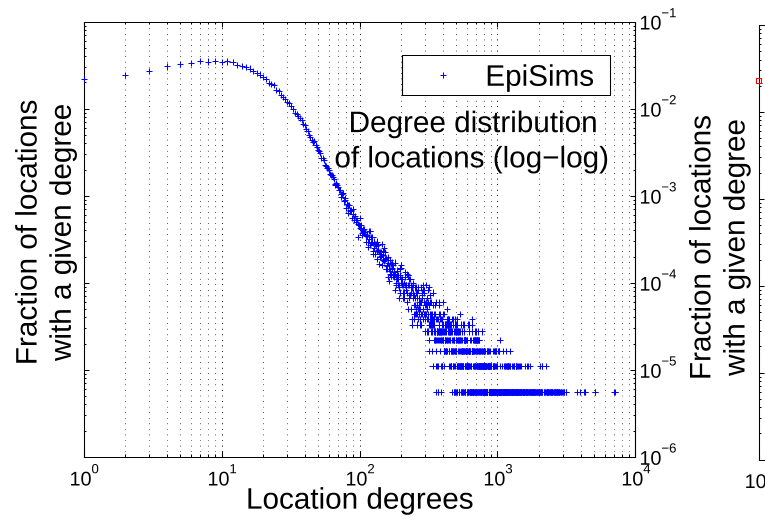 Figure 2: The power-law degree distribution of locations, showing the "long tail" of high-occupancy spots.
Critical Insight & Future Outlook
This work demonstrates that structural invariants in social networks aren't just academic curiosities; they are algorithmic shortcuts. By exploiting the power-law nature and high overlap of human movement, we can simulate urban-scale crises on standard hardware.
Limitations: The model assumes a "typical day" and may not capture the stochastic "burstiness" of special events or seasonal changes.
Future Work: The next leap lies in dynamic networks—how these graphs evolve minute-by-minute—and applying these fast generation techniques to even larger, global-scale contact networks to predict the next pandemic's trajectory.